Sudanese vs Immigrants from South Africa Currently Married
COMPARE
Sudanese
Immigrants from South Africa
Currently Married
Currently Married Comparison
Sudanese
Immigrants from South Africa
43.7%
CURRENTLY MARRIED
0.1/ 100
METRIC RATING
264th/ 347
METRIC RANK
48.1%
CURRENTLY MARRIED
97.0/ 100
METRIC RATING
79th/ 347
METRIC RANK
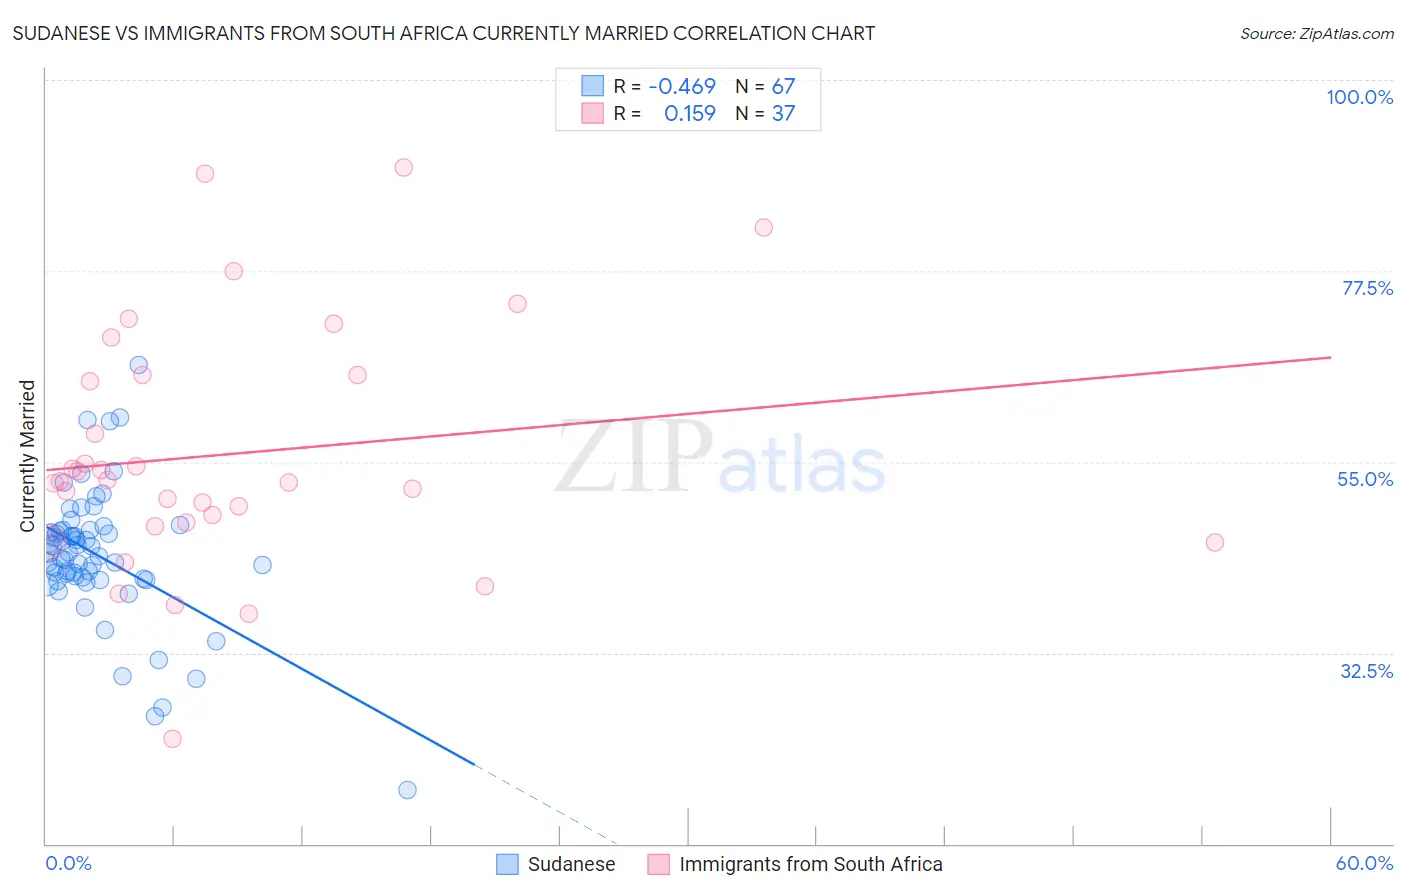
Sudanese vs Immigrants from South Africa Currently Married Correlation Chart
The statistical analysis conducted on geographies consisting of 110,133,540 people shows a moderate negative correlation between the proportion of Sudanese and percentage of population currently married in the United States with a correlation coefficient (R) of -0.469 and weighted average of 43.7%. Similarly, the statistical analysis conducted on geographies consisting of 233,308,336 people shows a poor positive correlation between the proportion of Immigrants from South Africa and percentage of population currently married in the United States with a correlation coefficient (R) of 0.159 and weighted average of 48.1%, a difference of 10.2%.
Currently Married Correlation Summary
| Measurement | Sudanese | Immigrants from South Africa |
| Minimum | 16.3% | 22.4% |
| Maximum | 66.4% | 89.7% |
| Range | 50.1% | 67.3% |
| Mean | 43.9% | 55.9% |
| Median | 44.3% | 52.7% |
| Interquartile 25% (IQ1) | 41.3% | 47.6% |
| Interquartile 75% (IQ3) | 46.9% | 65.2% |
| Interquartile Range (IQR) | 5.6% | 17.6% |
| Standard Deviation (Sample) | 8.0% | 14.6% |
| Standard Deviation (Population) | 7.9% | 14.4% |
Similar Demographics by Currently Married
Demographics Similar to Sudanese by Currently Married
In terms of currently married, the demographic groups most similar to Sudanese are Immigrants from Cuba (43.7%, a difference of 0.010%), Bangladeshi (43.7%, a difference of 0.050%), Immigrants from Bangladesh (43.6%, a difference of 0.080%), Ecuadorian (43.6%, a difference of 0.15%), and Immigrants from Eritrea (43.6%, a difference of 0.18%).
| Demographics | Rating | Rank | Currently Married |
| Immigrants | Africa | 0.2 /100 | #257 | Tragic 43.9% |
| Ute | 0.2 /100 | #258 | Tragic 43.9% |
| Immigrants | Sierra Leone | 0.1 /100 | #259 | Tragic 43.8% |
| Immigrants | Latin America | 0.1 /100 | #260 | Tragic 43.8% |
| Immigrants | Nicaragua | 0.1 /100 | #261 | Tragic 43.7% |
| Bangladeshis | 0.1 /100 | #262 | Tragic 43.7% |
| Immigrants | Cuba | 0.1 /100 | #263 | Tragic 43.7% |
| Sudanese | 0.1 /100 | #264 | Tragic 43.7% |
| Immigrants | Bangladesh | 0.1 /100 | #265 | Tragic 43.6% |
| Ecuadorians | 0.1 /100 | #266 | Tragic 43.6% |
| Immigrants | Eritrea | 0.1 /100 | #267 | Tragic 43.6% |
| Spanish American Indians | 0.1 /100 | #268 | Tragic 43.6% |
| Immigrants | Sudan | 0.1 /100 | #269 | Tragic 43.5% |
| Salvadorans | 0.1 /100 | #270 | Tragic 43.5% |
| Bermudans | 0.1 /100 | #271 | Tragic 43.5% |
Demographics Similar to Immigrants from South Africa by Currently Married
In terms of currently married, the demographic groups most similar to Immigrants from South Africa are Immigrants from Belgium (48.1%, a difference of 0.010%), Slovene (48.1%, a difference of 0.020%), Immigrants from Poland (48.1%, a difference of 0.030%), Basque (48.1%, a difference of 0.040%), and Immigrants from Sri Lanka (48.1%, a difference of 0.040%).
| Demographics | Rating | Rank | Currently Married |
| Immigrants | Lebanon | 97.6 /100 | #72 | Exceptional 48.2% |
| Immigrants | Eastern Asia | 97.5 /100 | #73 | Exceptional 48.2% |
| Estonians | 97.4 /100 | #74 | Exceptional 48.2% |
| Immigrants | Belarus | 97.2 /100 | #75 | Exceptional 48.1% |
| Basques | 97.2 /100 | #76 | Exceptional 48.1% |
| Slovenes | 97.1 /100 | #77 | Exceptional 48.1% |
| Immigrants | Belgium | 97.1 /100 | #78 | Exceptional 48.1% |
| Immigrants | South Africa | 97.0 /100 | #79 | Exceptional 48.1% |
| Immigrants | Poland | 96.9 /100 | #80 | Exceptional 48.1% |
| Immigrants | Sri Lanka | 96.9 /100 | #81 | Exceptional 48.1% |
| Immigrants | Europe | 96.9 /100 | #82 | Exceptional 48.1% |
| Bolivians | 96.9 /100 | #83 | Exceptional 48.1% |
| Immigrants | Israel | 96.9 /100 | #84 | Exceptional 48.1% |
| French Canadians | 96.3 /100 | #85 | Exceptional 48.0% |
| Immigrants | Japan | 96.2 /100 | #86 | Exceptional 48.0% |