Iroquois vs Immigrants from South Africa Currently Married
COMPARE
Iroquois
Immigrants from South Africa
Currently Married
Currently Married Comparison
Iroquois
Immigrants from South Africa
44.7%
CURRENTLY MARRIED
1.1/ 100
METRIC RATING
234th/ 347
METRIC RANK
48.1%
CURRENTLY MARRIED
97.0/ 100
METRIC RATING
79th/ 347
METRIC RANK
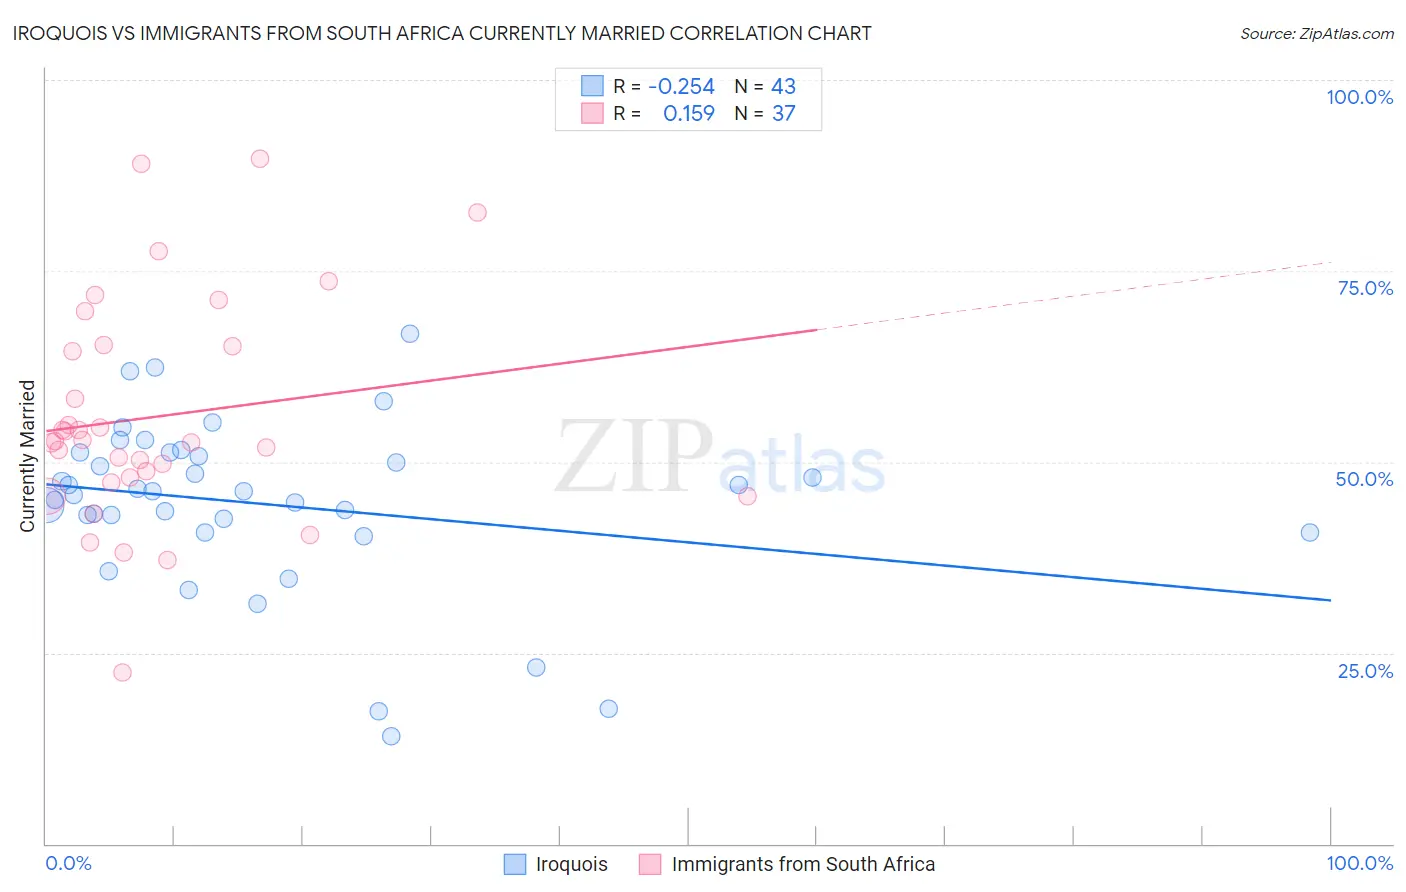
Iroquois vs Immigrants from South Africa Currently Married Correlation Chart
The statistical analysis conducted on geographies consisting of 207,297,556 people shows a weak negative correlation between the proportion of Iroquois and percentage of population currently married in the United States with a correlation coefficient (R) of -0.254 and weighted average of 44.7%. Similarly, the statistical analysis conducted on geographies consisting of 233,308,336 people shows a poor positive correlation between the proportion of Immigrants from South Africa and percentage of population currently married in the United States with a correlation coefficient (R) of 0.159 and weighted average of 48.1%, a difference of 7.6%.
Currently Married Correlation Summary
| Measurement | Iroquois | Immigrants from South Africa |
| Minimum | 14.1% | 22.4% |
| Maximum | 66.7% | 89.7% |
| Range | 52.6% | 67.3% |
| Mean | 44.5% | 55.9% |
| Median | 46.1% | 52.7% |
| Interquartile 25% (IQ1) | 40.7% | 47.6% |
| Interquartile 75% (IQ3) | 51.2% | 65.2% |
| Interquartile Range (IQR) | 10.5% | 17.6% |
| Standard Deviation (Sample) | 11.2% | 14.6% |
| Standard Deviation (Population) | 11.1% | 14.4% |
Similar Demographics by Currently Married
Demographics Similar to Iroquois by Currently Married
In terms of currently married, the demographic groups most similar to Iroquois are Immigrants from Saudi Arabia (44.7%, a difference of 0.010%), Nepalese (44.7%, a difference of 0.060%), Alaskan Athabascan (44.6%, a difference of 0.16%), Cuban (44.6%, a difference of 0.16%), and Seminole (44.6%, a difference of 0.17%).
| Demographics | Rating | Rank | Currently Married |
| Spanish Americans | 2.1 /100 | #227 | Tragic 45.0% |
| Immigrants | Uruguay | 2.0 /100 | #228 | Tragic 45.0% |
| Cree | 1.7 /100 | #229 | Tragic 44.9% |
| Immigrants | Kenya | 1.6 /100 | #230 | Tragic 44.9% |
| Immigrants | Panama | 1.5 /100 | #231 | Tragic 44.9% |
| Nepalese | 1.2 /100 | #232 | Tragic 44.7% |
| Immigrants | Saudi Arabia | 1.1 /100 | #233 | Tragic 44.7% |
| Iroquois | 1.1 /100 | #234 | Tragic 44.7% |
| Alaskan Athabascans | 0.9 /100 | #235 | Tragic 44.6% |
| Cubans | 0.9 /100 | #236 | Tragic 44.6% |
| Seminole | 0.9 /100 | #237 | Tragic 44.6% |
| Moroccans | 0.9 /100 | #238 | Tragic 44.6% |
| Immigrants | Mexico | 0.7 /100 | #239 | Tragic 44.5% |
| Mexican American Indians | 0.7 /100 | #240 | Tragic 44.5% |
| Ethiopians | 0.7 /100 | #241 | Tragic 44.5% |
Demographics Similar to Immigrants from South Africa by Currently Married
In terms of currently married, the demographic groups most similar to Immigrants from South Africa are Immigrants from Belgium (48.1%, a difference of 0.010%), Slovene (48.1%, a difference of 0.020%), Immigrants from Poland (48.1%, a difference of 0.030%), Basque (48.1%, a difference of 0.040%), and Immigrants from Sri Lanka (48.1%, a difference of 0.040%).
| Demographics | Rating | Rank | Currently Married |
| Immigrants | Lebanon | 97.6 /100 | #72 | Exceptional 48.2% |
| Immigrants | Eastern Asia | 97.5 /100 | #73 | Exceptional 48.2% |
| Estonians | 97.4 /100 | #74 | Exceptional 48.2% |
| Immigrants | Belarus | 97.2 /100 | #75 | Exceptional 48.1% |
| Basques | 97.2 /100 | #76 | Exceptional 48.1% |
| Slovenes | 97.1 /100 | #77 | Exceptional 48.1% |
| Immigrants | Belgium | 97.1 /100 | #78 | Exceptional 48.1% |
| Immigrants | South Africa | 97.0 /100 | #79 | Exceptional 48.1% |
| Immigrants | Poland | 96.9 /100 | #80 | Exceptional 48.1% |
| Immigrants | Sri Lanka | 96.9 /100 | #81 | Exceptional 48.1% |
| Immigrants | Europe | 96.9 /100 | #82 | Exceptional 48.1% |
| Bolivians | 96.9 /100 | #83 | Exceptional 48.1% |
| Immigrants | Israel | 96.9 /100 | #84 | Exceptional 48.1% |
| French Canadians | 96.3 /100 | #85 | Exceptional 48.0% |
| Immigrants | Japan | 96.2 /100 | #86 | Exceptional 48.0% |