Potawatomi vs Immigrants from Lithuania Average Family Size
COMPARE
Potawatomi
Immigrants from Lithuania
Average Family Size
Average Family Size Comparison
Potawatomi
Immigrants from Lithuania
3.16
AVERAGE FAMILY SIZE
1.3/ 100
METRIC RATING
259th/ 347
METRIC RANK
3.15
AVERAGE FAMILY SIZE
0.6/ 100
METRIC RATING
272nd/ 347
METRIC RANK
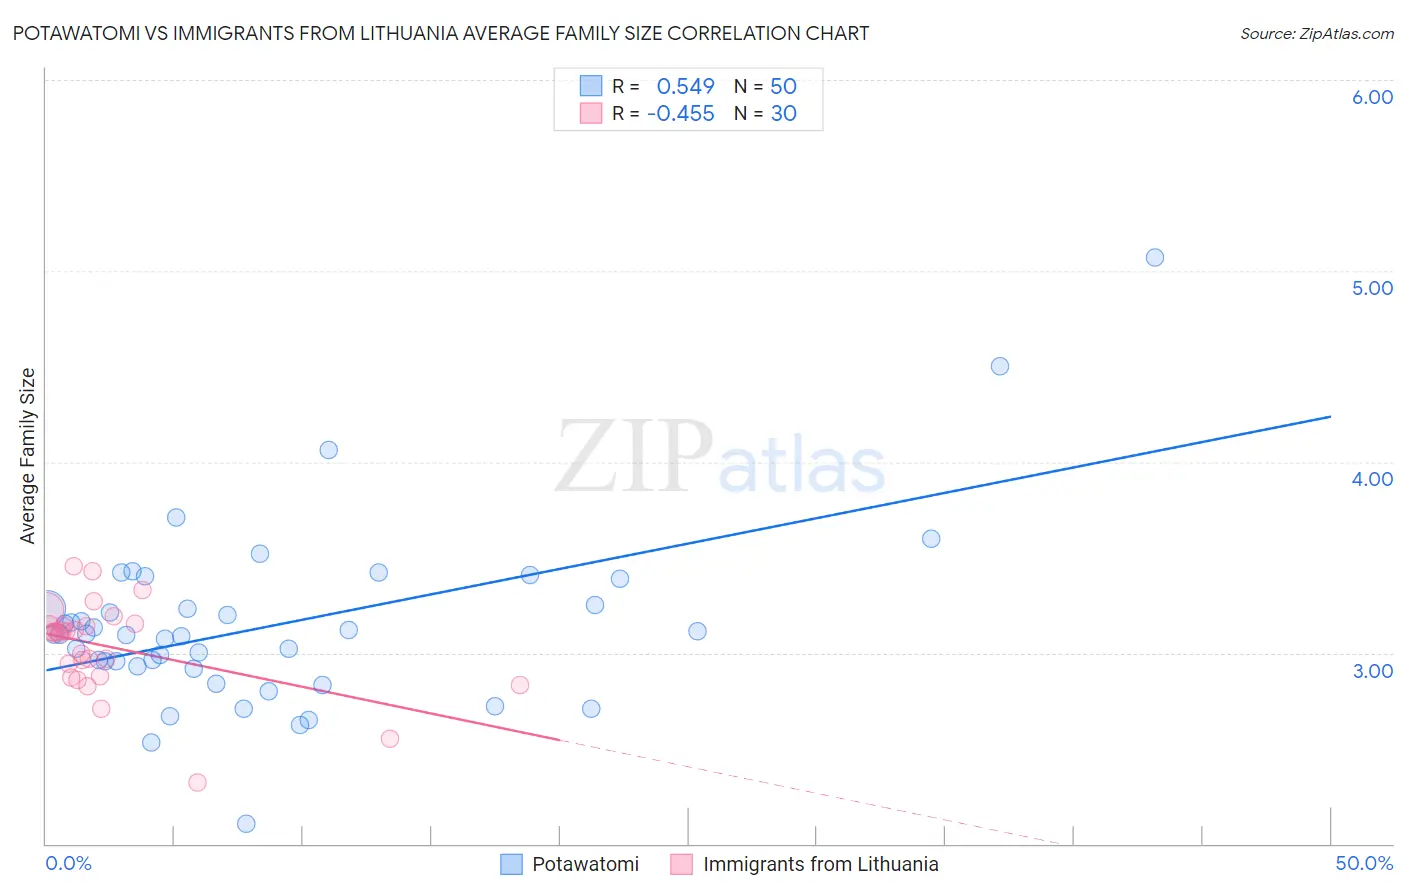
Potawatomi vs Immigrants from Lithuania Average Family Size Correlation Chart
The statistical analysis conducted on geographies consisting of 117,759,864 people shows a substantial positive correlation between the proportion of Potawatomi and average family size in the United States with a correlation coefficient (R) of 0.549 and weighted average of 3.16. Similarly, the statistical analysis conducted on geographies consisting of 117,713,976 people shows a moderate negative correlation between the proportion of Immigrants from Lithuania and average family size in the United States with a correlation coefficient (R) of -0.455 and weighted average of 3.15, a difference of 0.34%.
Average Family Size Correlation Summary
| Measurement | Potawatomi | Immigrants from Lithuania |
| Minimum | 2.10 | 2.32 |
| Maximum | 5.07 | 3.45 |
| Range | 2.97 | 1.13 |
| Mean | 3.15 | 3.03 |
| Median | 3.10 | 3.11 |
| Interquartile 25% (IQ1) | 2.93 | 2.88 |
| Interquartile 75% (IQ3) | 3.25 | 3.14 |
| Interquartile Range (IQR) | 0.32 | 0.26 |
| Standard Deviation (Sample) | 0.47 | 0.24 |
| Standard Deviation (Population) | 0.47 | 0.24 |
Demographics Similar to Potawatomi and Immigrants from Lithuania by Average Family Size
In terms of average family size, the demographic groups most similar to Potawatomi are Turkish (3.16, a difference of 0.0%), Immigrants from Albania (3.16, a difference of 0.0%), Immigrants from North Macedonia (3.16, a difference of 0.010%), Immigrants from Russia (3.16, a difference of 0.020%), and Albanian (3.17, a difference of 0.050%). Similarly, the demographic groups most similar to Immigrants from Lithuania are New Zealander (3.15, a difference of 0.010%), Immigrants from Germany (3.15, a difference of 0.020%), Immigrants from Belgium (3.15, a difference of 0.020%), Cambodian (3.15, a difference of 0.020%), and Tlingit-Haida (3.16, a difference of 0.040%).
| Demographics | Rating | Rank | Average Family Size |
| Cape Verdeans | 1.6 /100 | #255 | Tragic 3.17 |
| Immigrants | Kazakhstan | 1.5 /100 | #256 | Tragic 3.17 |
| Albanians | 1.5 /100 | #257 | Tragic 3.17 |
| Turks | 1.3 /100 | #258 | Tragic 3.16 |
| Potawatomi | 1.3 /100 | #259 | Tragic 3.16 |
| Immigrants | Albania | 1.3 /100 | #260 | Tragic 3.16 |
| Immigrants | North Macedonia | 1.3 /100 | #261 | Tragic 3.16 |
| Immigrants | Russia | 1.3 /100 | #262 | Tragic 3.16 |
| Immigrants | Bulgaria | 1.0 /100 | #263 | Tragic 3.16 |
| Americans | 1.0 /100 | #264 | Tragic 3.16 |
| Immigrants | South Africa | 0.9 /100 | #265 | Tragic 3.16 |
| Immigrants | Greece | 0.9 /100 | #266 | Tragic 3.16 |
| Iroquois | 0.8 /100 | #267 | Tragic 3.16 |
| Maltese | 0.8 /100 | #268 | Tragic 3.16 |
| Immigrants | Singapore | 0.7 /100 | #269 | Tragic 3.16 |
| Tlingit-Haida | 0.7 /100 | #270 | Tragic 3.16 |
| Immigrants | Germany | 0.7 /100 | #271 | Tragic 3.15 |
| Immigrants | Lithuania | 0.6 /100 | #272 | Tragic 3.15 |
| New Zealanders | 0.6 /100 | #273 | Tragic 3.15 |
| Immigrants | Belgium | 0.6 /100 | #274 | Tragic 3.15 |
| Cambodians | 0.6 /100 | #275 | Tragic 3.15 |