Argentinean vs Guatemalan Single Mother Households
COMPARE
Argentinean
Guatemalan
Single Mother Households
Single Mother Households Comparison
Argentineans
Guatemalans
5.8%
SINGLE MOTHER HOUSEHOLDS
93.7/ 100
METRIC RATING
121st/ 347
METRIC RANK
7.7%
SINGLE MOTHER HOUSEHOLDS
0.0/ 100
METRIC RATING
282nd/ 347
METRIC RANK
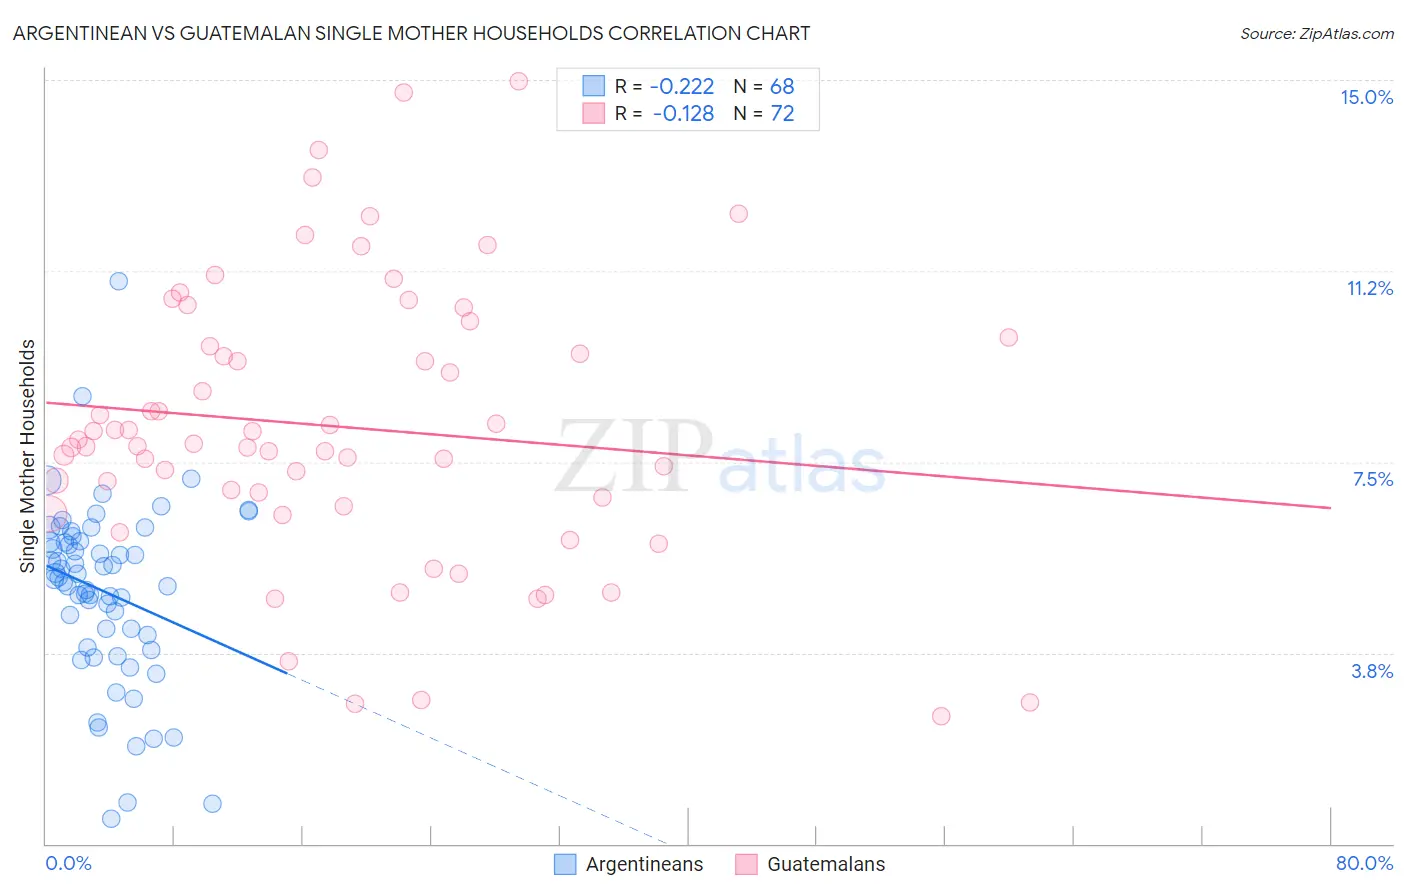
Argentinean vs Guatemalan Single Mother Households Correlation Chart
The statistical analysis conducted on geographies consisting of 296,614,684 people shows a weak negative correlation between the proportion of Argentineans and percentage of single mother households in the United States with a correlation coefficient (R) of -0.222 and weighted average of 5.8%. Similarly, the statistical analysis conducted on geographies consisting of 408,771,433 people shows a poor negative correlation between the proportion of Guatemalans and percentage of single mother households in the United States with a correlation coefficient (R) of -0.128 and weighted average of 7.7%, a difference of 31.1%.
Single Mother Households Correlation Summary
| Measurement | Argentinean | Guatemalan |
| Minimum | 0.49% | 2.5% |
| Maximum | 11.1% | 15.0% |
| Range | 10.6% | 12.5% |
| Mean | 5.0% | 8.2% |
| Median | 5.2% | 7.8% |
| Interquartile 25% (IQ1) | 4.0% | 6.7% |
| Interquartile 75% (IQ3) | 5.9% | 9.9% |
| Interquartile Range (IQR) | 1.9% | 3.1% |
| Standard Deviation (Sample) | 1.8% | 2.7% |
| Standard Deviation (Population) | 1.8% | 2.7% |
Similar Demographics by Single Mother Households
Demographics Similar to Argentineans by Single Mother Households
In terms of single mother households, the demographic groups most similar to Argentineans are Tongan (5.8%, a difference of 0.020%), Belgian (5.8%, a difference of 0.080%), Immigrants from Uzbekistan (5.9%, a difference of 0.14%), Immigrants from Argentina (5.9%, a difference of 0.21%), and South African (5.8%, a difference of 0.22%).
| Demographics | Rating | Rank | Single Mother Households |
| Dutch | 95.1 /100 | #114 | Exceptional 5.8% |
| Irish | 94.8 /100 | #115 | Exceptional 5.8% |
| Pennsylvania Germans | 94.7 /100 | #116 | Exceptional 5.8% |
| Bolivians | 94.6 /100 | #117 | Exceptional 5.8% |
| Laotians | 94.3 /100 | #118 | Exceptional 5.8% |
| South Africans | 94.1 /100 | #119 | Exceptional 5.8% |
| Tongans | 93.7 /100 | #120 | Exceptional 5.8% |
| Argentineans | 93.7 /100 | #121 | Exceptional 5.8% |
| Belgians | 93.5 /100 | #122 | Exceptional 5.8% |
| Immigrants | Uzbekistan | 93.4 /100 | #123 | Exceptional 5.9% |
| Immigrants | Argentina | 93.2 /100 | #124 | Exceptional 5.9% |
| Slavs | 92.9 /100 | #125 | Exceptional 5.9% |
| Welsh | 92.8 /100 | #126 | Exceptional 5.9% |
| Lebanese | 92.4 /100 | #127 | Exceptional 5.9% |
| Czechoslovakians | 92.2 /100 | #128 | Exceptional 5.9% |
Demographics Similar to Guatemalans by Single Mother Households
In terms of single mother households, the demographic groups most similar to Guatemalans are Immigrants from Sierra Leone (7.7%, a difference of 0.020%), Immigrants from Laos (7.7%, a difference of 0.020%), Nigerian (7.7%, a difference of 0.030%), Immigrants from El Salvador (7.6%, a difference of 0.54%), and Immigrants from Belize (7.7%, a difference of 0.63%).
| Demographics | Rating | Rank | Single Mother Households |
| Central American Indians | 0.1 /100 | #275 | Tragic 7.6% |
| Guyanese | 0.1 /100 | #276 | Tragic 7.6% |
| Immigrants | Trinidad and Tobago | 0.1 /100 | #277 | Tragic 7.6% |
| Central Americans | 0.1 /100 | #278 | Tragic 7.6% |
| Immigrants | El Salvador | 0.0 /100 | #279 | Tragic 7.6% |
| Immigrants | Sierra Leone | 0.0 /100 | #280 | Tragic 7.7% |
| Immigrants | Laos | 0.0 /100 | #281 | Tragic 7.7% |
| Guatemalans | 0.0 /100 | #282 | Tragic 7.7% |
| Nigerians | 0.0 /100 | #283 | Tragic 7.7% |
| Immigrants | Belize | 0.0 /100 | #284 | Tragic 7.7% |
| Trinidadians and Tobagonians | 0.0 /100 | #285 | Tragic 7.7% |
| Immigrants | Middle Africa | 0.0 /100 | #286 | Tragic 7.7% |
| Immigrants | Guatemala | 0.0 /100 | #287 | Tragic 7.7% |
| Sierra Leoneans | 0.0 /100 | #288 | Tragic 7.7% |
| Sub-Saharan Africans | 0.0 /100 | #289 | Tragic 7.8% |