Arab vs Luxembourger Average Family Size
COMPARE
Arab
Luxembourger
Average Family Size
Average Family Size Comparison
Arabs
Luxembourgers
3.23
AVERAGE FAMILY SIZE
53.8/ 100
METRIC RATING
170th/ 347
METRIC RANK
3.10
AVERAGE FAMILY SIZE
0.0/ 100
METRIC RATING
335th/ 347
METRIC RANK
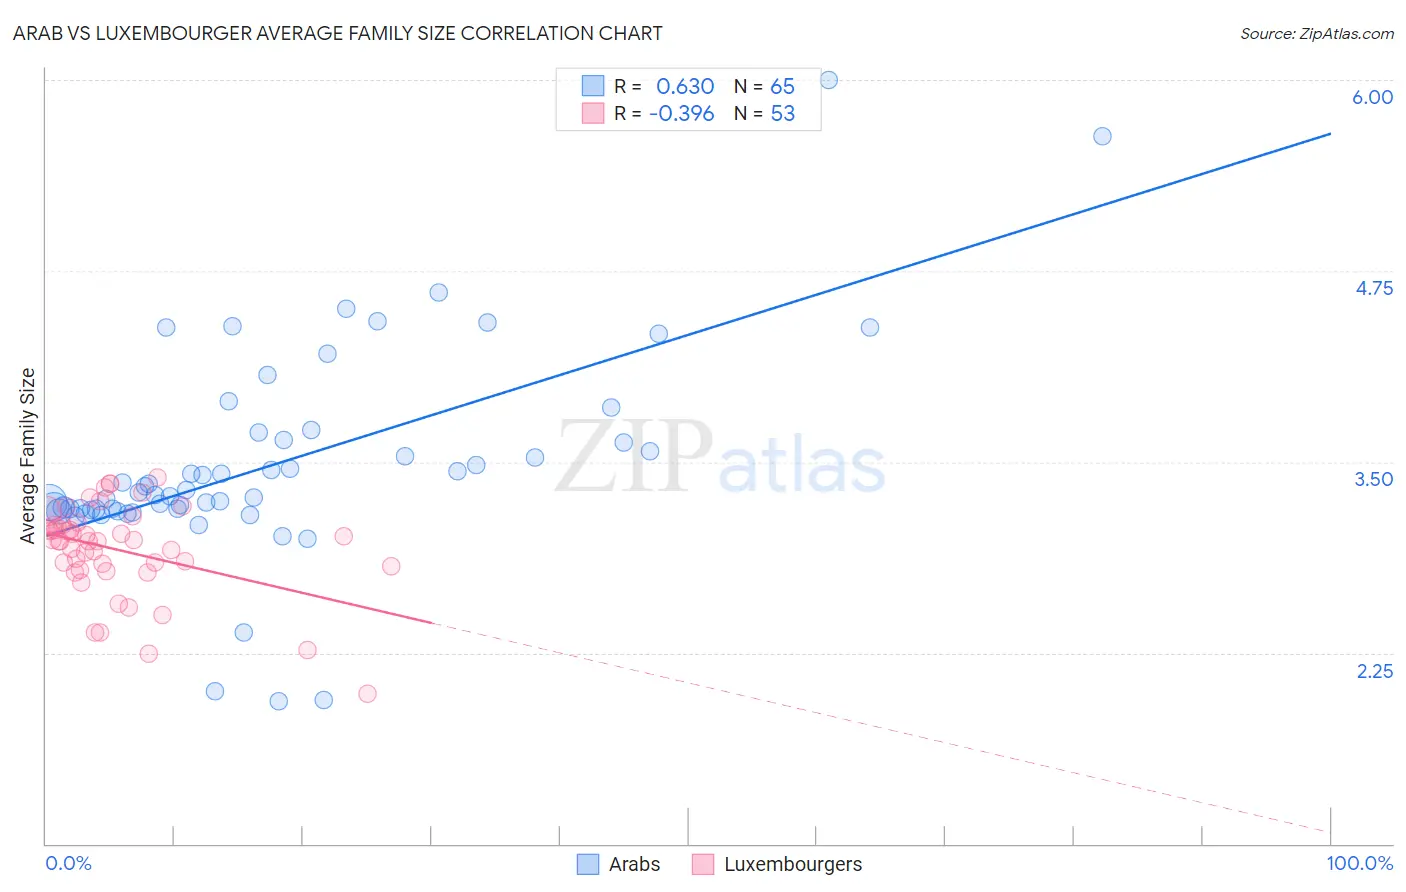
Arab vs Luxembourger Average Family Size Correlation Chart
The statistical analysis conducted on geographies consisting of 486,389,490 people shows a significant positive correlation between the proportion of Arabs and average family size in the United States with a correlation coefficient (R) of 0.630 and weighted average of 3.23. Similarly, the statistical analysis conducted on geographies consisting of 144,654,567 people shows a mild negative correlation between the proportion of Luxembourgers and average family size in the United States with a correlation coefficient (R) of -0.396 and weighted average of 3.10, a difference of 4.1%.
Average Family Size Correlation Summary
| Measurement | Arab | Luxembourger |
| Minimum | 1.93 | 1.98 |
| Maximum | 6.00 | 3.40 |
| Range | 4.07 | 1.42 |
| Mean | 3.49 | 2.92 |
| Median | 3.30 | 2.98 |
| Interquartile 25% (IQ1) | 3.19 | 2.81 |
| Interquartile 75% (IQ3) | 3.67 | 3.09 |
| Interquartile Range (IQR) | 0.48 | 0.28 |
| Standard Deviation (Sample) | 0.69 | 0.30 |
| Standard Deviation (Population) | 0.68 | 0.30 |
Similar Demographics by Average Family Size
Demographics Similar to Arabs by Average Family Size
In terms of average family size, the demographic groups most similar to Arabs are Taiwanese (3.23, a difference of 0.010%), Aleut (3.23, a difference of 0.010%), Chilean (3.23, a difference of 0.010%), Immigrants from Congo (3.23, a difference of 0.020%), and Immigrants from Uruguay (3.23, a difference of 0.030%).
| Demographics | Rating | Rank | Average Family Size |
| Uruguayans | 58.8 /100 | #163 | Average 3.23 |
| Egyptians | 58.6 /100 | #164 | Average 3.23 |
| Ugandans | 58.4 /100 | #165 | Average 3.23 |
| Immigrants | Senegal | 57.5 /100 | #166 | Average 3.23 |
| Dutch West Indians | 56.9 /100 | #167 | Average 3.23 |
| Taiwanese | 54.2 /100 | #168 | Average 3.23 |
| Aleuts | 54.1 /100 | #169 | Average 3.23 |
| Arabs | 53.8 /100 | #170 | Average 3.23 |
| Chileans | 53.2 /100 | #171 | Average 3.23 |
| Immigrants | Congo | 52.7 /100 | #172 | Average 3.23 |
| Immigrants | Uruguay | 52.0 /100 | #173 | Average 3.23 |
| Immigrants | South Central Asia | 50.0 /100 | #174 | Average 3.23 |
| Immigrants | China | 49.9 /100 | #175 | Average 3.23 |
| Israelis | 48.7 /100 | #176 | Average 3.23 |
| Argentineans | 47.4 /100 | #177 | Average 3.23 |
Demographics Similar to Luxembourgers by Average Family Size
In terms of average family size, the demographic groups most similar to Luxembourgers are Estonian (3.10, a difference of 0.030%), Lithuanian (3.10, a difference of 0.030%), Irish (3.10, a difference of 0.060%), Scotch-Irish (3.11, a difference of 0.080%), and Scottish (3.11, a difference of 0.080%).
| Demographics | Rating | Rank | Average Family Size |
| Czechs | 0.0 /100 | #328 | Tragic 3.11 |
| Belgians | 0.0 /100 | #329 | Tragic 3.11 |
| Latvians | 0.0 /100 | #330 | Tragic 3.11 |
| Scotch-Irish | 0.0 /100 | #331 | Tragic 3.11 |
| Scottish | 0.0 /100 | #332 | Tragic 3.11 |
| Estonians | 0.0 /100 | #333 | Tragic 3.10 |
| Lithuanians | 0.0 /100 | #334 | Tragic 3.10 |
| Luxembourgers | 0.0 /100 | #335 | Tragic 3.10 |
| Irish | 0.0 /100 | #336 | Tragic 3.10 |
| Swedes | 0.0 /100 | #337 | Tragic 3.10 |
| French | 0.0 /100 | #338 | Tragic 3.10 |
| Croatians | 0.0 /100 | #339 | Tragic 3.10 |
| Finns | 0.0 /100 | #340 | Tragic 3.09 |
| Poles | 0.0 /100 | #341 | Tragic 3.09 |
| Germans | 0.0 /100 | #342 | Tragic 3.09 |