Arab vs Immigrants from Trinidad and Tobago Average Family Size
COMPARE
Arab
Immigrants from Trinidad and Tobago
Average Family Size
Average Family Size Comparison
Arabs
Immigrants from Trinidad and Tobago
3.23
AVERAGE FAMILY SIZE
53.8/ 100
METRIC RATING
170th/ 347
METRIC RANK
3.33
AVERAGE FAMILY SIZE
99.9/ 100
METRIC RATING
70th/ 347
METRIC RANK
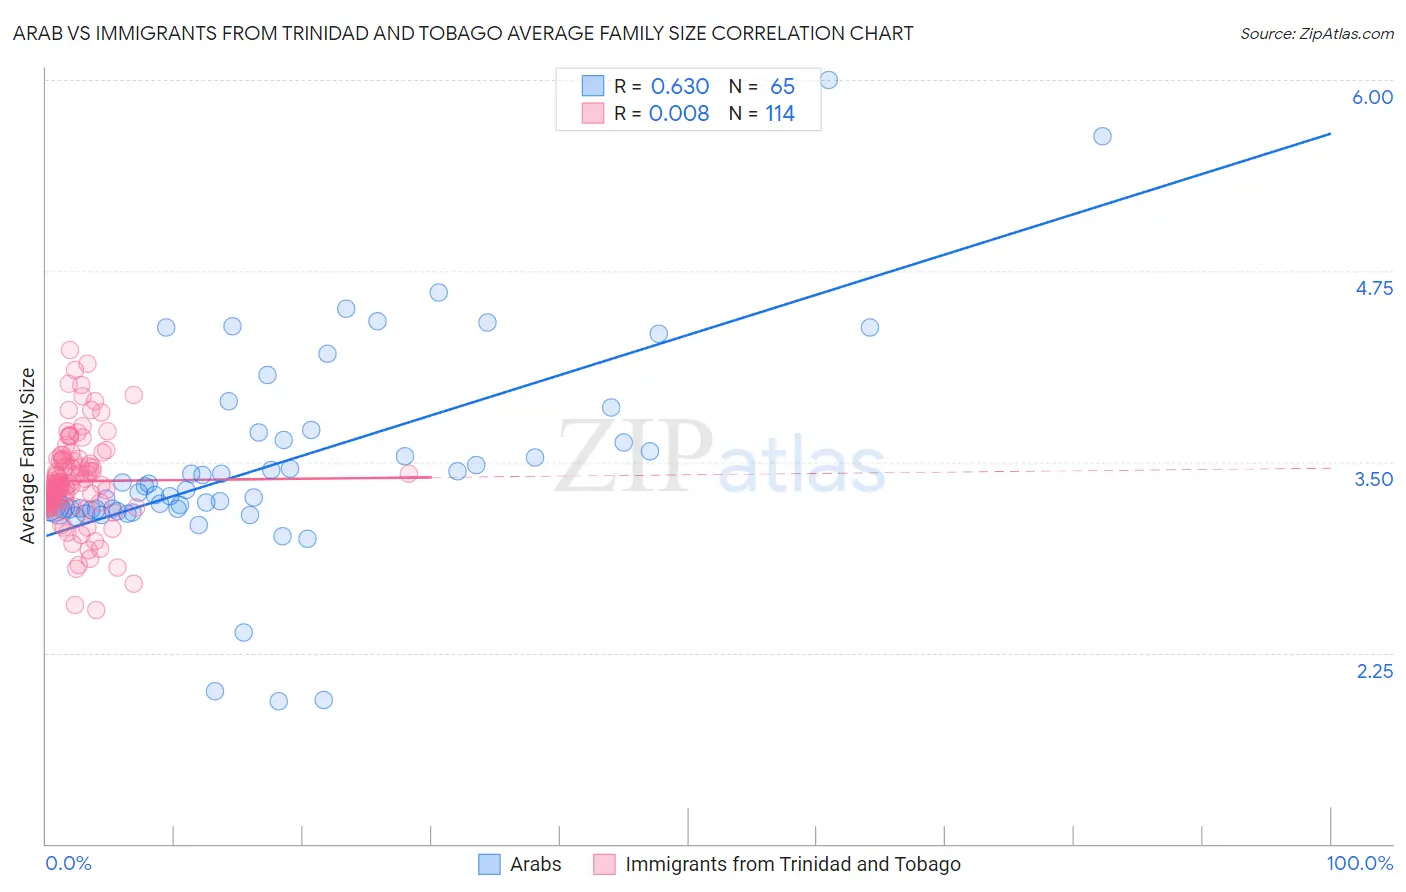
Arab vs Immigrants from Trinidad and Tobago Average Family Size Correlation Chart
The statistical analysis conducted on geographies consisting of 486,389,490 people shows a significant positive correlation between the proportion of Arabs and average family size in the United States with a correlation coefficient (R) of 0.630 and weighted average of 3.23. Similarly, the statistical analysis conducted on geographies consisting of 223,484,407 people shows no correlation between the proportion of Immigrants from Trinidad and Tobago and average family size in the United States with a correlation coefficient (R) of 0.008 and weighted average of 3.33, a difference of 3.0%.
Average Family Size Correlation Summary
| Measurement | Arab | Immigrants from Trinidad and Tobago |
| Minimum | 1.93 | 2.53 |
| Maximum | 6.00 | 4.23 |
| Range | 4.07 | 1.70 |
| Mean | 3.49 | 3.37 |
| Median | 3.30 | 3.36 |
| Interquartile 25% (IQ1) | 3.19 | 3.23 |
| Interquartile 75% (IQ3) | 3.67 | 3.51 |
| Interquartile Range (IQR) | 0.48 | 0.28 |
| Standard Deviation (Sample) | 0.69 | 0.30 |
| Standard Deviation (Population) | 0.68 | 0.30 |
Similar Demographics by Average Family Size
Demographics Similar to Arabs by Average Family Size
In terms of average family size, the demographic groups most similar to Arabs are Taiwanese (3.23, a difference of 0.010%), Aleut (3.23, a difference of 0.010%), Chilean (3.23, a difference of 0.010%), Immigrants from Congo (3.23, a difference of 0.020%), and Immigrants from Uruguay (3.23, a difference of 0.030%).
| Demographics | Rating | Rank | Average Family Size |
| Uruguayans | 58.8 /100 | #163 | Average 3.23 |
| Egyptians | 58.6 /100 | #164 | Average 3.23 |
| Ugandans | 58.4 /100 | #165 | Average 3.23 |
| Immigrants | Senegal | 57.5 /100 | #166 | Average 3.23 |
| Dutch West Indians | 56.9 /100 | #167 | Average 3.23 |
| Taiwanese | 54.2 /100 | #168 | Average 3.23 |
| Aleuts | 54.1 /100 | #169 | Average 3.23 |
| Arabs | 53.8 /100 | #170 | Average 3.23 |
| Chileans | 53.2 /100 | #171 | Average 3.23 |
| Immigrants | Congo | 52.7 /100 | #172 | Average 3.23 |
| Immigrants | Uruguay | 52.0 /100 | #173 | Average 3.23 |
| Immigrants | South Central Asia | 50.0 /100 | #174 | Average 3.23 |
| Immigrants | China | 49.9 /100 | #175 | Average 3.23 |
| Israelis | 48.7 /100 | #176 | Average 3.23 |
| Argentineans | 47.4 /100 | #177 | Average 3.23 |
Demographics Similar to Immigrants from Trinidad and Tobago by Average Family Size
In terms of average family size, the demographic groups most similar to Immigrants from Trinidad and Tobago are Immigrants from West Indies (3.33, a difference of 0.010%), Immigrants (3.33, a difference of 0.050%), Immigrants from Cambodia (3.33, a difference of 0.080%), Immigrants from Caribbean (3.33, a difference of 0.080%), and Yaqui (3.32, a difference of 0.11%).
| Demographics | Rating | Rank | Average Family Size |
| Chinese | 100.0 /100 | #63 | Exceptional 3.34 |
| Dominicans | 99.9 /100 | #64 | Exceptional 3.34 |
| Immigrants | Laos | 99.9 /100 | #65 | Exceptional 3.34 |
| Immigrants | St. Vincent and the Grenadines | 99.9 /100 | #66 | Exceptional 3.34 |
| Immigrants | Jamaica | 99.9 /100 | #67 | Exceptional 3.33 |
| Immigrants | Cambodia | 99.9 /100 | #68 | Exceptional 3.33 |
| Immigrants | Immigrants | 99.9 /100 | #69 | Exceptional 3.33 |
| Immigrants | Trinidad and Tobago | 99.9 /100 | #70 | Exceptional 3.33 |
| Immigrants | West Indies | 99.9 /100 | #71 | Exceptional 3.33 |
| Immigrants | Caribbean | 99.9 /100 | #72 | Exceptional 3.33 |
| Yaqui | 99.9 /100 | #73 | Exceptional 3.32 |
| Immigrants | Sierra Leone | 99.9 /100 | #74 | Exceptional 3.32 |
| Immigrants | Barbados | 99.8 /100 | #75 | Exceptional 3.32 |
| Trinidadians and Tobagonians | 99.8 /100 | #76 | Exceptional 3.32 |
| Immigrants | Ecuador | 99.8 /100 | #77 | Exceptional 3.32 |