Scottish vs Immigrants from Ecuador Family Households
COMPARE
Scottish
Immigrants from Ecuador
Family Households
Family Households Comparison
Scottish
Immigrants from Ecuador
64.5%
FAMILY HOUSEHOLDS
70.9/ 100
METRIC RATING
152nd/ 347
METRIC RANK
64.8%
FAMILY HOUSEHOLDS
91.4/ 100
METRIC RATING
129th/ 347
METRIC RANK
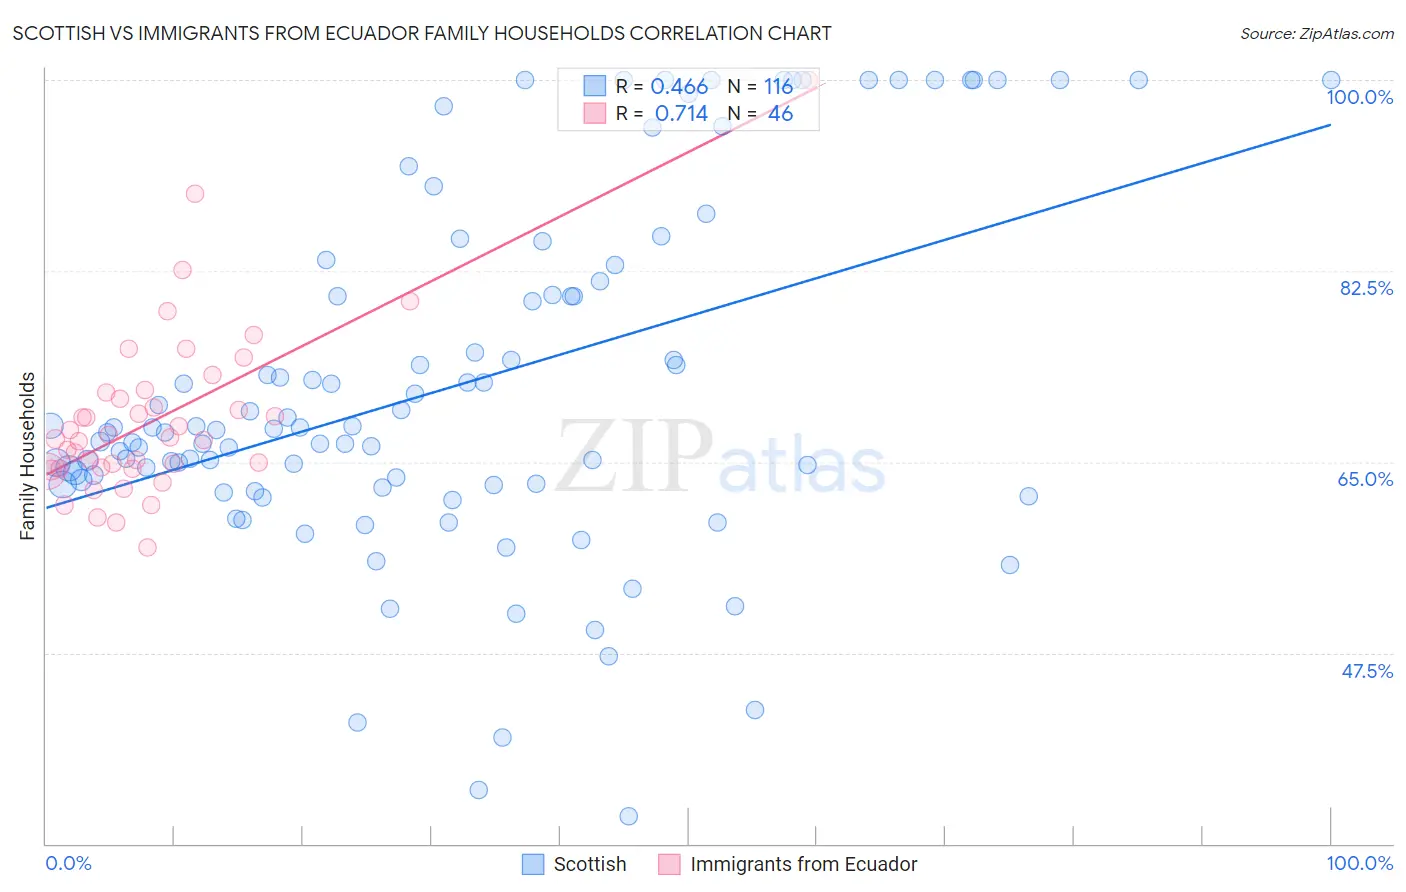
Scottish vs Immigrants from Ecuador Family Households Correlation Chart
The statistical analysis conducted on geographies consisting of 566,567,551 people shows a moderate positive correlation between the proportion of Scottish and percentage of family households in the United States with a correlation coefficient (R) of 0.466 and weighted average of 64.5%. Similarly, the statistical analysis conducted on geographies consisting of 270,888,190 people shows a strong positive correlation between the proportion of Immigrants from Ecuador and percentage of family households in the United States with a correlation coefficient (R) of 0.714 and weighted average of 64.8%, a difference of 0.49%.
Family Households Correlation Summary
| Measurement | Scottish | Immigrants from Ecuador |
| Minimum | 32.6% | 57.2% |
| Maximum | 100.0% | 100.0% |
| Range | 67.4% | 42.8% |
| Mean | 71.9% | 69.0% |
| Median | 67.9% | 67.2% |
| Interquartile 25% (IQ1) | 63.0% | 64.4% |
| Interquartile 75% (IQ3) | 80.9% | 71.4% |
| Interquartile Range (IQR) | 18.0% | 7.0% |
| Standard Deviation (Sample) | 16.1% | 7.8% |
| Standard Deviation (Population) | 16.1% | 7.8% |
Similar Demographics by Family Households
Demographics Similar to Scottish by Family Households
In terms of family households, the demographic groups most similar to Scottish are Swedish (64.5%, a difference of 0.020%), Austrian (64.5%, a difference of 0.040%), Uruguayan (64.5%, a difference of 0.050%), Czech (64.5%, a difference of 0.060%), and Romanian (64.5%, a difference of 0.070%).
| Demographics | Rating | Rank | Family Households |
| Welsh | 80.1 /100 | #145 | Excellent 64.6% |
| Immigrants | Romania | 77.0 /100 | #146 | Good 64.6% |
| Immigrants | Chile | 76.5 /100 | #147 | Good 64.6% |
| Delaware | 76.3 /100 | #148 | Good 64.6% |
| Sioux | 76.3 /100 | #149 | Good 64.6% |
| Romanians | 75.3 /100 | #150 | Good 64.5% |
| Syrians | 75.2 /100 | #151 | Good 64.5% |
| Scottish | 70.9 /100 | #152 | Good 64.5% |
| Swedes | 69.8 /100 | #153 | Good 64.5% |
| Austrians | 68.5 /100 | #154 | Good 64.5% |
| Uruguayans | 67.7 /100 | #155 | Good 64.5% |
| Czechs | 67.0 /100 | #156 | Good 64.5% |
| Canadians | 66.6 /100 | #157 | Good 64.4% |
| Lebanese | 66.4 /100 | #158 | Good 64.4% |
| Germans | 65.8 /100 | #159 | Good 64.4% |
Demographics Similar to Immigrants from Ecuador by Family Households
In terms of family households, the demographic groups most similar to Immigrants from Ecuador are Italian (64.8%, a difference of 0.020%), Immigrants from Panama (64.8%, a difference of 0.030%), Panamanian (64.8%, a difference of 0.050%), Immigrants from Italy (64.8%, a difference of 0.050%), and Nonimmigrants (64.8%, a difference of 0.050%).
| Demographics | Rating | Rank | Family Households |
| Hmong | 93.4 /100 | #122 | Exceptional 64.9% |
| Choctaw | 93.4 /100 | #123 | Exceptional 64.9% |
| Immigrants | Argentina | 92.8 /100 | #124 | Exceptional 64.9% |
| Immigrants | Belize | 92.7 /100 | #125 | Exceptional 64.9% |
| Panamanians | 92.4 /100 | #126 | Exceptional 64.8% |
| Immigrants | Panama | 92.0 /100 | #127 | Exceptional 64.8% |
| Italians | 91.9 /100 | #128 | Exceptional 64.8% |
| Immigrants | Ecuador | 91.4 /100 | #129 | Exceptional 64.8% |
| Immigrants | Italy | 90.2 /100 | #130 | Exceptional 64.8% |
| Immigrants | Nonimmigrants | 90.1 /100 | #131 | Exceptional 64.8% |
| Cajuns | 89.4 /100 | #132 | Excellent 64.8% |
| Belizeans | 89.3 /100 | #133 | Excellent 64.8% |
| Greeks | 88.1 /100 | #134 | Excellent 64.7% |
| Maltese | 87.4 /100 | #135 | Excellent 64.7% |
| Immigrants | China | 86.6 /100 | #136 | Excellent 64.7% |