Immigrants from Pakistan vs Immigrants from Ecuador Family Households
COMPARE
Immigrants from Pakistan
Immigrants from Ecuador
Family Households
Family Households Comparison
Immigrants from Pakistan
Immigrants from Ecuador
67.7%
FAMILY HOUSEHOLDS
100.0/ 100
METRIC RATING
23rd/ 347
METRIC RANK
64.8%
FAMILY HOUSEHOLDS
91.4/ 100
METRIC RATING
129th/ 347
METRIC RANK
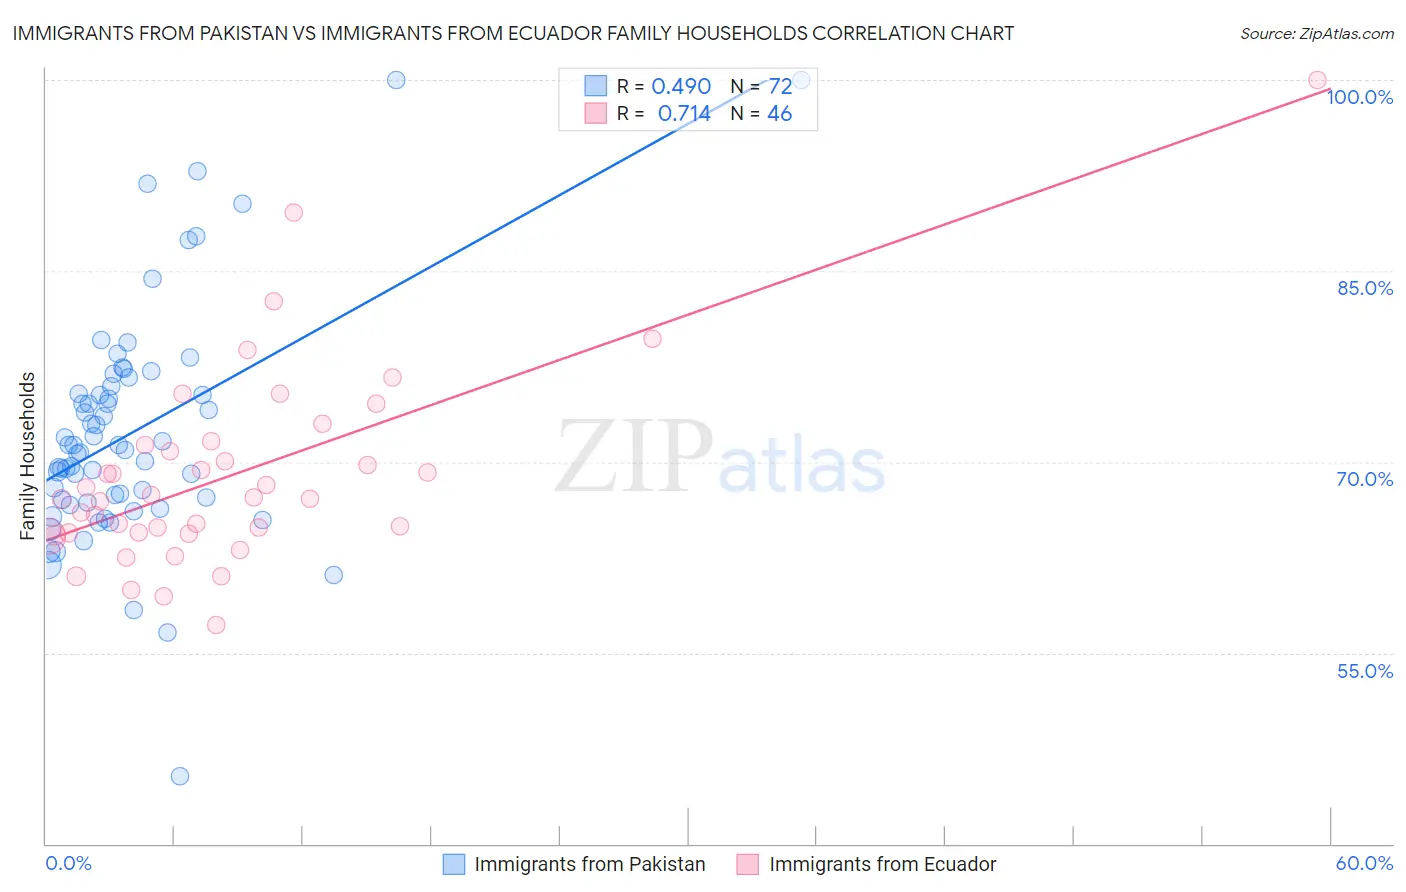
Immigrants from Pakistan vs Immigrants from Ecuador Family Households Correlation Chart
The statistical analysis conducted on geographies consisting of 283,802,176 people shows a moderate positive correlation between the proportion of Immigrants from Pakistan and percentage of family households in the United States with a correlation coefficient (R) of 0.490 and weighted average of 67.7%. Similarly, the statistical analysis conducted on geographies consisting of 270,888,190 people shows a strong positive correlation between the proportion of Immigrants from Ecuador and percentage of family households in the United States with a correlation coefficient (R) of 0.714 and weighted average of 64.8%, a difference of 4.4%.
Family Households Correlation Summary
| Measurement | Immigrants from Pakistan | Immigrants from Ecuador |
| Minimum | 45.3% | 57.2% |
| Maximum | 100.0% | 100.0% |
| Range | 54.7% | 42.8% |
| Mean | 72.3% | 69.0% |
| Median | 71.1% | 67.2% |
| Interquartile 25% (IQ1) | 66.9% | 64.4% |
| Interquartile 75% (IQ3) | 75.7% | 71.4% |
| Interquartile Range (IQR) | 8.8% | 7.0% |
| Standard Deviation (Sample) | 9.1% | 7.8% |
| Standard Deviation (Population) | 9.1% | 7.8% |
Similar Demographics by Family Households
Demographics Similar to Immigrants from Pakistan by Family Households
In terms of family households, the demographic groups most similar to Immigrants from Pakistan are Sri Lankan (67.7%, a difference of 0.090%), Cuban (67.7%, a difference of 0.12%), Inupiat (67.8%, a difference of 0.17%), Immigrants from South Eastern Asia (67.5%, a difference of 0.28%), and Immigrants from Nicaragua (67.5%, a difference of 0.31%).
| Demographics | Rating | Rank | Family Households |
| Immigrants | Vietnam | 100.0 /100 | #16 | Exceptional 68.2% |
| Chinese | 100.0 /100 | #17 | Exceptional 68.1% |
| Immigrants | Taiwan | 100.0 /100 | #18 | Exceptional 68.0% |
| Samoans | 100.0 /100 | #19 | Exceptional 67.9% |
| Inupiat | 100.0 /100 | #20 | Exceptional 67.8% |
| Cubans | 100.0 /100 | #21 | Exceptional 67.7% |
| Sri Lankans | 100.0 /100 | #22 | Exceptional 67.7% |
| Immigrants | Pakistan | 100.0 /100 | #23 | Exceptional 67.7% |
| Immigrants | South Eastern Asia | 100.0 /100 | #24 | Exceptional 67.5% |
| Immigrants | Nicaragua | 100.0 /100 | #25 | Exceptional 67.5% |
| Immigrants | India | 100.0 /100 | #26 | Exceptional 67.4% |
| Hispanics or Latinos | 100.0 /100 | #27 | Exceptional 67.4% |
| Hawaiians | 100.0 /100 | #28 | Exceptional 67.4% |
| Nicaraguans | 100.0 /100 | #29 | Exceptional 67.4% |
| Immigrants | Peru | 100.0 /100 | #30 | Exceptional 67.2% |
Demographics Similar to Immigrants from Ecuador by Family Households
In terms of family households, the demographic groups most similar to Immigrants from Ecuador are Italian (64.8%, a difference of 0.020%), Immigrants from Panama (64.8%, a difference of 0.030%), Panamanian (64.8%, a difference of 0.050%), Immigrants from Italy (64.8%, a difference of 0.050%), and Nonimmigrants (64.8%, a difference of 0.050%).
| Demographics | Rating | Rank | Family Households |
| Hmong | 93.4 /100 | #122 | Exceptional 64.9% |
| Choctaw | 93.4 /100 | #123 | Exceptional 64.9% |
| Immigrants | Argentina | 92.8 /100 | #124 | Exceptional 64.9% |
| Immigrants | Belize | 92.7 /100 | #125 | Exceptional 64.9% |
| Panamanians | 92.4 /100 | #126 | Exceptional 64.8% |
| Immigrants | Panama | 92.0 /100 | #127 | Exceptional 64.8% |
| Italians | 91.9 /100 | #128 | Exceptional 64.8% |
| Immigrants | Ecuador | 91.4 /100 | #129 | Exceptional 64.8% |
| Immigrants | Italy | 90.2 /100 | #130 | Exceptional 64.8% |
| Immigrants | Nonimmigrants | 90.1 /100 | #131 | Exceptional 64.8% |
| Cajuns | 89.4 /100 | #132 | Excellent 64.8% |
| Belizeans | 89.3 /100 | #133 | Excellent 64.8% |
| Greeks | 88.1 /100 | #134 | Excellent 64.7% |
| Maltese | 87.4 /100 | #135 | Excellent 64.7% |
| Immigrants | China | 86.6 /100 | #136 | Excellent 64.7% |