Finnish vs Immigrants from Ecuador Family Households
COMPARE
Finnish
Immigrants from Ecuador
Family Households
Family Households Comparison
Finns
Immigrants from Ecuador
63.5%
FAMILY HOUSEHOLDS
2.3/ 100
METRIC RATING
234th/ 347
METRIC RANK
64.8%
FAMILY HOUSEHOLDS
91.4/ 100
METRIC RATING
129th/ 347
METRIC RANK
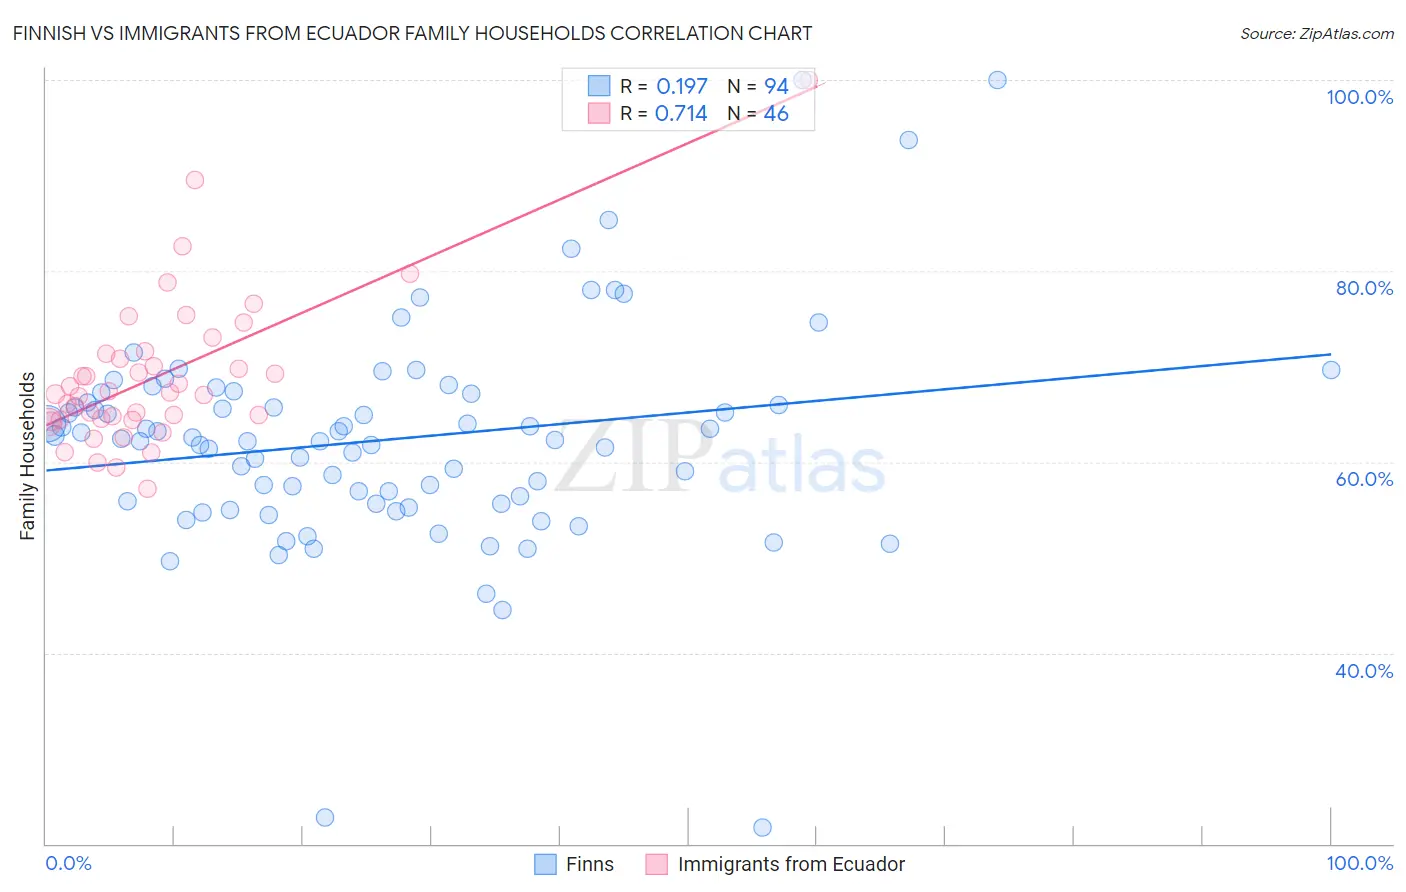
Finnish vs Immigrants from Ecuador Family Households Correlation Chart
The statistical analysis conducted on geographies consisting of 404,508,203 people shows a poor positive correlation between the proportion of Finns and percentage of family households in the United States with a correlation coefficient (R) of 0.197 and weighted average of 63.5%. Similarly, the statistical analysis conducted on geographies consisting of 270,888,190 people shows a strong positive correlation between the proportion of Immigrants from Ecuador and percentage of family households in the United States with a correlation coefficient (R) of 0.714 and weighted average of 64.8%, a difference of 2.1%.
Family Households Correlation Summary
| Measurement | Finnish | Immigrants from Ecuador |
| Minimum | 21.6% | 57.2% |
| Maximum | 100.0% | 100.0% |
| Range | 78.4% | 42.8% |
| Mean | 62.3% | 69.0% |
| Median | 62.4% | 67.2% |
| Interquartile 25% (IQ1) | 55.6% | 64.4% |
| Interquartile 75% (IQ3) | 67.1% | 71.4% |
| Interquartile Range (IQR) | 11.5% | 7.0% |
| Standard Deviation (Sample) | 11.6% | 7.8% |
| Standard Deviation (Population) | 11.6% | 7.8% |
Similar Demographics by Family Households
Demographics Similar to Finns by Family Households
In terms of family households, the demographic groups most similar to Finns are Immigrants from Armenia (63.5%, a difference of 0.030%), Albanian (63.5%, a difference of 0.030%), Immigrants from Northern Africa (63.5%, a difference of 0.040%), Ghanaian (63.5%, a difference of 0.040%), and Comanche (63.5%, a difference of 0.040%).
| Demographics | Rating | Rank | Family Households |
| Trinidadians and Tobagonians | 4.1 /100 | #227 | Tragic 63.6% |
| Blackfeet | 3.6 /100 | #228 | Tragic 63.6% |
| Bulgarians | 3.4 /100 | #229 | Tragic 63.6% |
| Immigrants | Brazil | 3.0 /100 | #230 | Tragic 63.6% |
| Immigrants | Greece | 2.9 /100 | #231 | Tragic 63.5% |
| Immigrants | Northern Africa | 2.6 /100 | #232 | Tragic 63.5% |
| Immigrants | Armenia | 2.6 /100 | #233 | Tragic 63.5% |
| Finns | 2.3 /100 | #234 | Tragic 63.5% |
| Albanians | 2.2 /100 | #235 | Tragic 63.5% |
| Ghanaians | 2.1 /100 | #236 | Tragic 63.5% |
| Comanche | 2.1 /100 | #237 | Tragic 63.5% |
| Immigrants | Zimbabwe | 2.0 /100 | #238 | Tragic 63.5% |
| Aleuts | 1.9 /100 | #239 | Tragic 63.4% |
| South Africans | 1.9 /100 | #240 | Tragic 63.4% |
| Immigrants | St. Vincent and the Grenadines | 1.9 /100 | #241 | Tragic 63.4% |
Demographics Similar to Immigrants from Ecuador by Family Households
In terms of family households, the demographic groups most similar to Immigrants from Ecuador are Italian (64.8%, a difference of 0.020%), Immigrants from Panama (64.8%, a difference of 0.030%), Panamanian (64.8%, a difference of 0.050%), Immigrants from Italy (64.8%, a difference of 0.050%), and Nonimmigrants (64.8%, a difference of 0.050%).
| Demographics | Rating | Rank | Family Households |
| Hmong | 93.4 /100 | #122 | Exceptional 64.9% |
| Choctaw | 93.4 /100 | #123 | Exceptional 64.9% |
| Immigrants | Argentina | 92.8 /100 | #124 | Exceptional 64.9% |
| Immigrants | Belize | 92.7 /100 | #125 | Exceptional 64.9% |
| Panamanians | 92.4 /100 | #126 | Exceptional 64.8% |
| Immigrants | Panama | 92.0 /100 | #127 | Exceptional 64.8% |
| Italians | 91.9 /100 | #128 | Exceptional 64.8% |
| Immigrants | Ecuador | 91.4 /100 | #129 | Exceptional 64.8% |
| Immigrants | Italy | 90.2 /100 | #130 | Exceptional 64.8% |
| Immigrants | Nonimmigrants | 90.1 /100 | #131 | Exceptional 64.8% |
| Cajuns | 89.4 /100 | #132 | Excellent 64.8% |
| Belizeans | 89.3 /100 | #133 | Excellent 64.8% |
| Greeks | 88.1 /100 | #134 | Excellent 64.7% |
| Maltese | 87.4 /100 | #135 | Excellent 64.7% |
| Immigrants | China | 86.6 /100 | #136 | Excellent 64.7% |