Apache vs Sri Lankan Currently Married
COMPARE
Apache
Sri Lankan
Currently Married
Currently Married Comparison
Apache
Sri Lankans
43.2%
CURRENTLY MARRIED
0.0/ 100
METRIC RATING
280th/ 347
METRIC RANK
47.3%
CURRENTLY MARRIED
83.2/ 100
METRIC RATING
129th/ 347
METRIC RANK
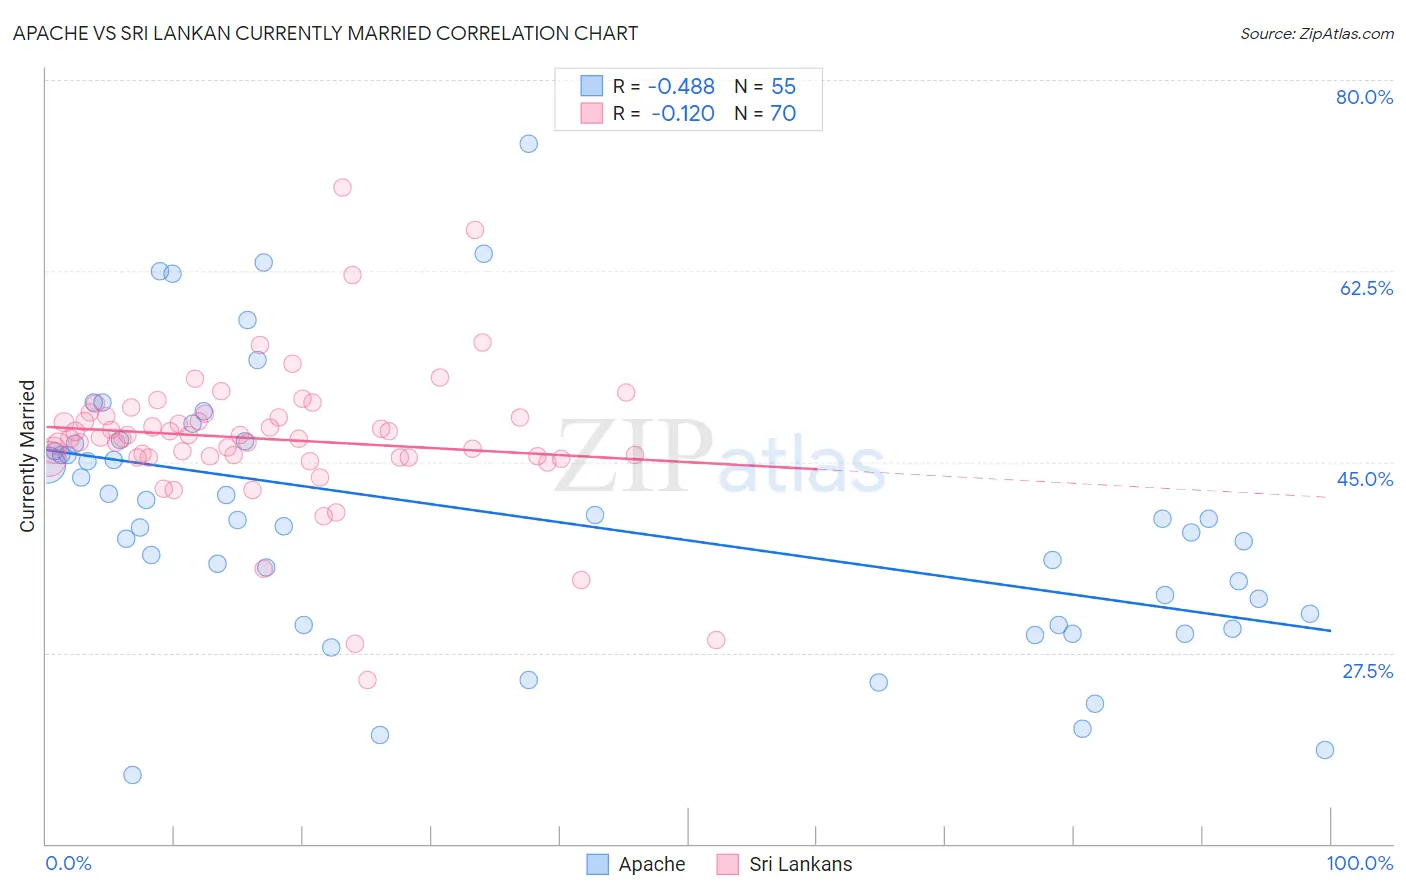
Apache vs Sri Lankan Currently Married Correlation Chart
The statistical analysis conducted on geographies consisting of 231,125,444 people shows a moderate negative correlation between the proportion of Apache and percentage of population currently married in the United States with a correlation coefficient (R) of -0.488 and weighted average of 43.2%. Similarly, the statistical analysis conducted on geographies consisting of 440,506,479 people shows a poor negative correlation between the proportion of Sri Lankans and percentage of population currently married in the United States with a correlation coefficient (R) of -0.120 and weighted average of 47.3%, a difference of 9.4%.
Currently Married Correlation Summary
| Measurement | Apache | Sri Lankan |
| Minimum | 16.3% | 25.0% |
| Maximum | 74.2% | 70.1% |
| Range | 57.9% | 45.1% |
| Mean | 40.0% | 47.1% |
| Median | 39.7% | 47.2% |
| Interquartile 25% (IQ1) | 30.0% | 45.4% |
| Interquartile 75% (IQ3) | 46.7% | 49.2% |
| Interquartile Range (IQR) | 16.7% | 3.8% |
| Standard Deviation (Sample) | 12.3% | 6.8% |
| Standard Deviation (Population) | 12.2% | 6.8% |
Similar Demographics by Currently Married
Demographics Similar to Apache by Currently Married
In terms of currently married, the demographic groups most similar to Apache are Chippewa (43.2%, a difference of 0.010%), Central American Indian (43.3%, a difference of 0.080%), Immigrants from Ecuador (43.2%, a difference of 0.080%), Kiowa (43.2%, a difference of 0.19%), and Immigrants from El Salvador (43.1%, a difference of 0.20%).
| Demographics | Rating | Rank | Currently Married |
| Yaqui | 0.1 /100 | #273 | Tragic 43.4% |
| Nigerians | 0.1 /100 | #274 | Tragic 43.4% |
| Colville | 0.1 /100 | #275 | Tragic 43.4% |
| Sierra Leoneans | 0.1 /100 | #276 | Tragic 43.4% |
| Immigrants | Nigeria | 0.1 /100 | #277 | Tragic 43.4% |
| Central Americans | 0.0 /100 | #278 | Tragic 43.3% |
| Central American Indians | 0.0 /100 | #279 | Tragic 43.3% |
| Apache | 0.0 /100 | #280 | Tragic 43.2% |
| Chippewa | 0.0 /100 | #281 | Tragic 43.2% |
| Immigrants | Ecuador | 0.0 /100 | #282 | Tragic 43.2% |
| Kiowa | 0.0 /100 | #283 | Tragic 43.2% |
| Immigrants | El Salvador | 0.0 /100 | #284 | Tragic 43.1% |
| Immigrants | Middle Africa | 0.0 /100 | #285 | Tragic 43.0% |
| Ghanaians | 0.0 /100 | #286 | Tragic 42.9% |
| Guatemalans | 0.0 /100 | #287 | Tragic 42.9% |
Demographics Similar to Sri Lankans by Currently Married
In terms of currently married, the demographic groups most similar to Sri Lankans are Immigrants from Iraq (47.3%, a difference of 0.030%), Icelander (47.3%, a difference of 0.050%), Portuguese (47.3%, a difference of 0.060%), Afghan (47.3%, a difference of 0.090%), and Immigrants from Jordan (47.4%, a difference of 0.11%).
| Demographics | Rating | Rank | Currently Married |
| Osage | 87.9 /100 | #122 | Excellent 47.5% |
| Immigrants | Kazakhstan | 87.2 /100 | #123 | Excellent 47.4% |
| Laotians | 86.6 /100 | #124 | Excellent 47.4% |
| Okinawans | 85.3 /100 | #125 | Excellent 47.4% |
| Immigrants | Jordan | 84.9 /100 | #126 | Excellent 47.4% |
| New Zealanders | 84.9 /100 | #127 | Excellent 47.4% |
| Portuguese | 84.2 /100 | #128 | Excellent 47.3% |
| Sri Lankans | 83.2 /100 | #129 | Excellent 47.3% |
| Immigrants | Iraq | 82.8 /100 | #130 | Excellent 47.3% |
| Icelanders | 82.4 /100 | #131 | Excellent 47.3% |
| Afghans | 81.8 /100 | #132 | Excellent 47.3% |
| Immigrants | Malaysia | 81.1 /100 | #133 | Excellent 47.3% |
| Immigrants | Australia | 81.1 /100 | #134 | Excellent 47.3% |
| Immigrants | Norway | 79.7 /100 | #135 | Good 47.2% |
| Immigrants | Vietnam | 78.2 /100 | #136 | Good 47.2% |