Alsatian vs Cuban Currently Married
COMPARE
Alsatian
Cuban
Currently Married
Currently Married Comparison
Alsatians
Cubans
45.7%
CURRENTLY MARRIED
10.8/ 100
METRIC RATING
208th/ 347
METRIC RANK
44.6%
CURRENTLY MARRIED
0.9/ 100
METRIC RATING
236th/ 347
METRIC RANK
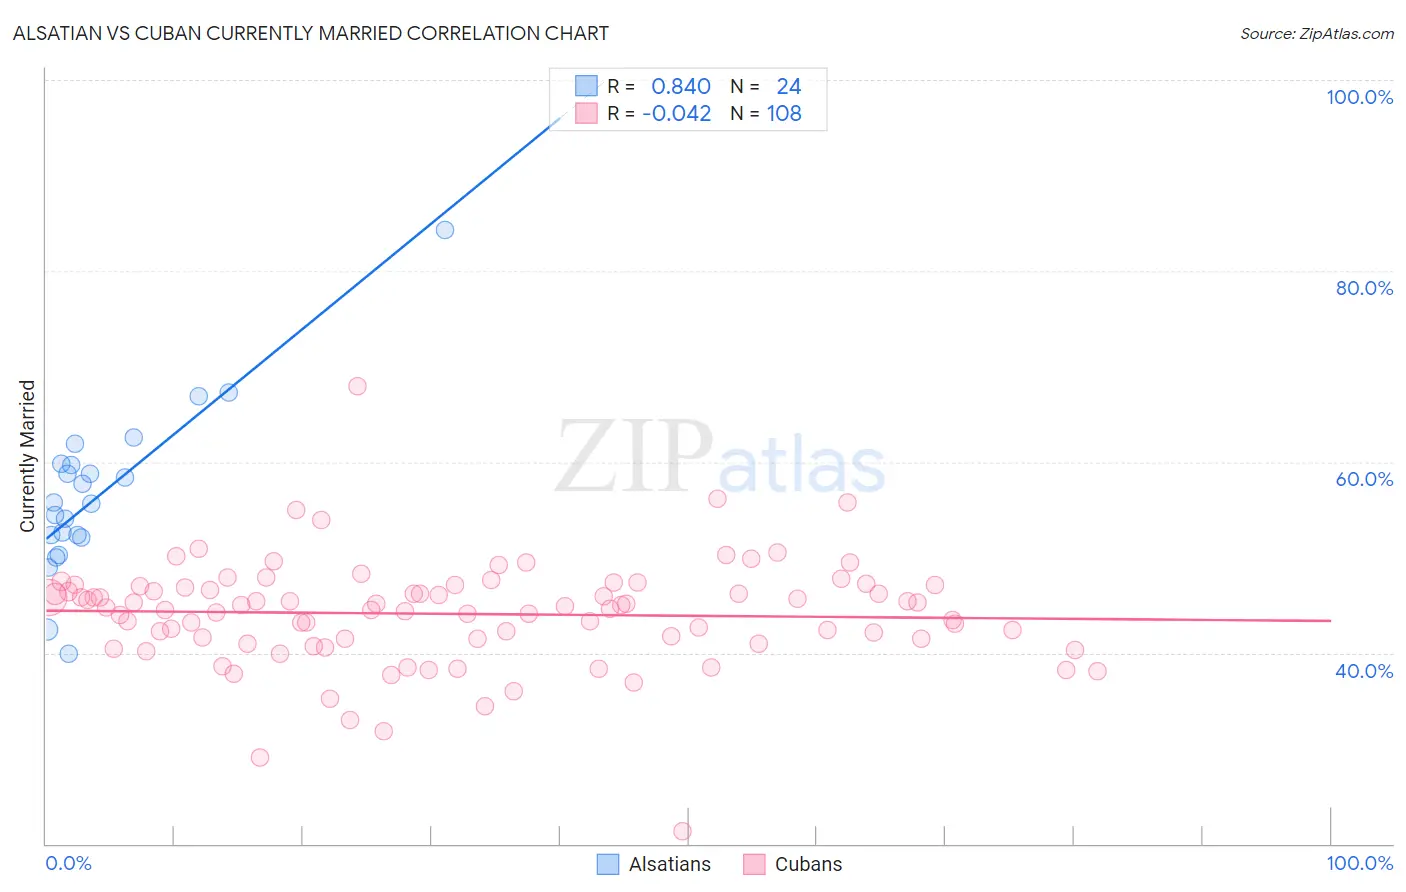
Alsatian vs Cuban Currently Married Correlation Chart
The statistical analysis conducted on geographies consisting of 82,681,658 people shows a very strong positive correlation between the proportion of Alsatians and percentage of population currently married in the United States with a correlation coefficient (R) of 0.840 and weighted average of 45.7%. Similarly, the statistical analysis conducted on geographies consisting of 449,312,568 people shows no correlation between the proportion of Cubans and percentage of population currently married in the United States with a correlation coefficient (R) of -0.042 and weighted average of 44.6%, a difference of 2.4%.
Currently Married Correlation Summary
| Measurement | Alsatian | Cuban |
| Minimum | 39.9% | 21.3% |
| Maximum | 84.3% | 67.9% |
| Range | 44.4% | 46.6% |
| Mean | 56.5% | 44.1% |
| Median | 55.7% | 44.8% |
| Interquartile 25% (IQ1) | 52.2% | 41.4% |
| Interquartile 75% (IQ3) | 59.7% | 46.9% |
| Interquartile Range (IQR) | 7.5% | 5.4% |
| Standard Deviation (Sample) | 8.8% | 5.7% |
| Standard Deviation (Population) | 8.6% | 5.6% |
Similar Demographics by Currently Married
Demographics Similar to Alsatians by Currently Married
In terms of currently married, the demographic groups most similar to Alsatians are Immigrants from South America (45.7%, a difference of 0.010%), Immigrants (45.8%, a difference of 0.050%), South American Indian (45.8%, a difference of 0.070%), Immigrants from Spain (45.8%, a difference of 0.080%), and Taiwanese (45.8%, a difference of 0.090%).
| Demographics | Rating | Rank | Currently Married |
| Malaysians | 15.3 /100 | #201 | Poor 45.9% |
| Immigrants | Albania | 14.5 /100 | #202 | Poor 45.9% |
| Taiwanese | 11.7 /100 | #203 | Poor 45.8% |
| Immigrants | Spain | 11.6 /100 | #204 | Poor 45.8% |
| South American Indians | 11.5 /100 | #205 | Poor 45.8% |
| Immigrants | Immigrants | 11.2 /100 | #206 | Poor 45.8% |
| Immigrants | South America | 10.8 /100 | #207 | Poor 45.7% |
| Alsatians | 10.8 /100 | #208 | Poor 45.7% |
| Immigrants | Micronesia | 8.8 /100 | #209 | Tragic 45.6% |
| Uruguayans | 7.9 /100 | #210 | Tragic 45.6% |
| Houma | 7.2 /100 | #211 | Tragic 45.5% |
| Marshallese | 7.2 /100 | #212 | Tragic 45.5% |
| Alaska Natives | 7.0 /100 | #213 | Tragic 45.5% |
| Dutch West Indians | 6.7 /100 | #214 | Tragic 45.5% |
| German Russians | 6.7 /100 | #215 | Tragic 45.5% |
Demographics Similar to Cubans by Currently Married
In terms of currently married, the demographic groups most similar to Cubans are Seminole (44.6%, a difference of 0.0%), Alaskan Athabascan (44.6%, a difference of 0.010%), Moroccan (44.6%, a difference of 0.080%), Iroquois (44.7%, a difference of 0.16%), and Immigrants from Saudi Arabia (44.7%, a difference of 0.17%).
| Demographics | Rating | Rank | Currently Married |
| Cree | 1.7 /100 | #229 | Tragic 44.9% |
| Immigrants | Kenya | 1.6 /100 | #230 | Tragic 44.9% |
| Immigrants | Panama | 1.5 /100 | #231 | Tragic 44.9% |
| Nepalese | 1.2 /100 | #232 | Tragic 44.7% |
| Immigrants | Saudi Arabia | 1.1 /100 | #233 | Tragic 44.7% |
| Iroquois | 1.1 /100 | #234 | Tragic 44.7% |
| Alaskan Athabascans | 0.9 /100 | #235 | Tragic 44.6% |
| Cubans | 0.9 /100 | #236 | Tragic 44.6% |
| Seminole | 0.9 /100 | #237 | Tragic 44.6% |
| Moroccans | 0.9 /100 | #238 | Tragic 44.6% |
| Immigrants | Mexico | 0.7 /100 | #239 | Tragic 44.5% |
| Mexican American Indians | 0.7 /100 | #240 | Tragic 44.5% |
| Ethiopians | 0.7 /100 | #241 | Tragic 44.5% |
| Immigrants | Cambodia | 0.7 /100 | #242 | Tragic 44.5% |
| Immigrants | Ethiopia | 0.7 /100 | #243 | Tragic 44.5% |