Alsatian vs Immigrants from Liberia Currently Married
COMPARE
Alsatian
Immigrants from Liberia
Currently Married
Currently Married Comparison
Alsatians
Immigrants from Liberia
45.7%
CURRENTLY MARRIED
10.8/ 100
METRIC RATING
208th/ 347
METRIC RANK
41.8%
CURRENTLY MARRIED
0.0/ 100
METRIC RATING
309th/ 347
METRIC RANK
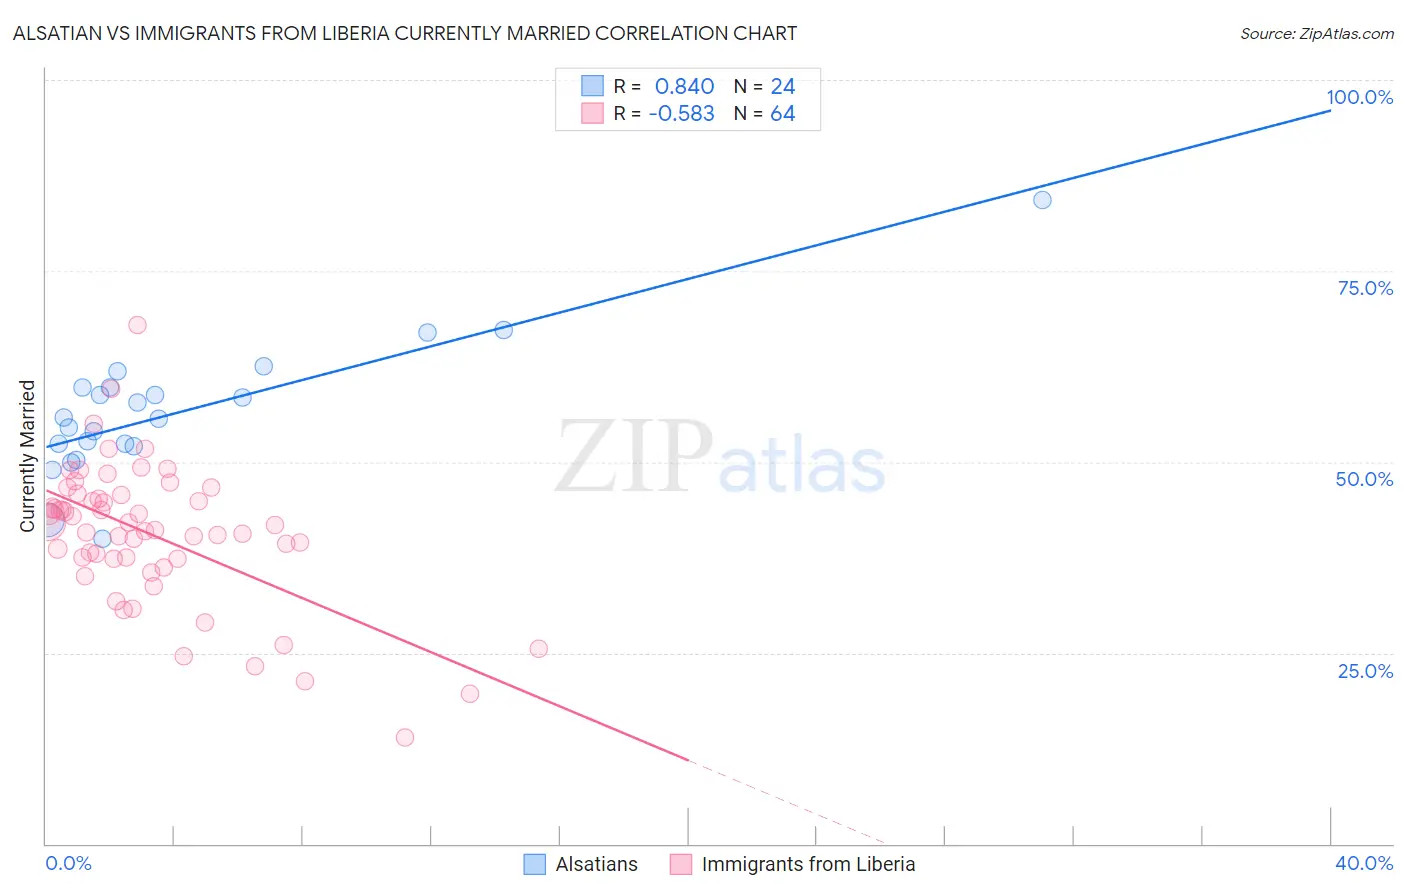
Alsatian vs Immigrants from Liberia Currently Married Correlation Chart
The statistical analysis conducted on geographies consisting of 82,681,658 people shows a very strong positive correlation between the proportion of Alsatians and percentage of population currently married in the United States with a correlation coefficient (R) of 0.840 and weighted average of 45.7%. Similarly, the statistical analysis conducted on geographies consisting of 135,288,317 people shows a substantial negative correlation between the proportion of Immigrants from Liberia and percentage of population currently married in the United States with a correlation coefficient (R) of -0.583 and weighted average of 41.8%, a difference of 9.5%.
Currently Married Correlation Summary
| Measurement | Alsatian | Immigrants from Liberia |
| Minimum | 39.9% | 13.9% |
| Maximum | 84.3% | 68.0% |
| Range | 44.4% | 54.1% |
| Mean | 56.5% | 40.5% |
| Median | 55.7% | 41.4% |
| Interquartile 25% (IQ1) | 52.2% | 37.3% |
| Interquartile 75% (IQ3) | 59.7% | 45.4% |
| Interquartile Range (IQR) | 7.5% | 8.2% |
| Standard Deviation (Sample) | 8.8% | 9.3% |
| Standard Deviation (Population) | 8.6% | 9.2% |
Similar Demographics by Currently Married
Demographics Similar to Alsatians by Currently Married
In terms of currently married, the demographic groups most similar to Alsatians are Immigrants from South America (45.7%, a difference of 0.010%), Immigrants (45.8%, a difference of 0.050%), South American Indian (45.8%, a difference of 0.070%), Immigrants from Spain (45.8%, a difference of 0.080%), and Taiwanese (45.8%, a difference of 0.090%).
| Demographics | Rating | Rank | Currently Married |
| Malaysians | 15.3 /100 | #201 | Poor 45.9% |
| Immigrants | Albania | 14.5 /100 | #202 | Poor 45.9% |
| Taiwanese | 11.7 /100 | #203 | Poor 45.8% |
| Immigrants | Spain | 11.6 /100 | #204 | Poor 45.8% |
| South American Indians | 11.5 /100 | #205 | Poor 45.8% |
| Immigrants | Immigrants | 11.2 /100 | #206 | Poor 45.8% |
| Immigrants | South America | 10.8 /100 | #207 | Poor 45.7% |
| Alsatians | 10.8 /100 | #208 | Poor 45.7% |
| Immigrants | Micronesia | 8.8 /100 | #209 | Tragic 45.6% |
| Uruguayans | 7.9 /100 | #210 | Tragic 45.6% |
| Houma | 7.2 /100 | #211 | Tragic 45.5% |
| Marshallese | 7.2 /100 | #212 | Tragic 45.5% |
| Alaska Natives | 7.0 /100 | #213 | Tragic 45.5% |
| Dutch West Indians | 6.7 /100 | #214 | Tragic 45.5% |
| German Russians | 6.7 /100 | #215 | Tragic 45.5% |
Demographics Similar to Immigrants from Liberia by Currently Married
In terms of currently married, the demographic groups most similar to Immigrants from Liberia are Immigrants from Belize (41.8%, a difference of 0.11%), African (41.8%, a difference of 0.15%), Immigrants from Guyana (41.9%, a difference of 0.29%), Immigrants from Trinidad and Tobago (41.9%, a difference of 0.30%), and Immigrants from Bahamas (41.9%, a difference of 0.33%).
| Demographics | Rating | Rank | Currently Married |
| Immigrants | Zaire | 0.0 /100 | #302 | Tragic 42.0% |
| Sioux | 0.0 /100 | #303 | Tragic 41.9% |
| Immigrants | Bahamas | 0.0 /100 | #304 | Tragic 41.9% |
| Immigrants | Trinidad and Tobago | 0.0 /100 | #305 | Tragic 41.9% |
| Immigrants | Guyana | 0.0 /100 | #306 | Tragic 41.9% |
| Africans | 0.0 /100 | #307 | Tragic 41.8% |
| Immigrants | Belize | 0.0 /100 | #308 | Tragic 41.8% |
| Immigrants | Liberia | 0.0 /100 | #309 | Tragic 41.8% |
| Guyanese | 0.0 /100 | #310 | Tragic 41.6% |
| Trinidadians and Tobagonians | 0.0 /100 | #311 | Tragic 41.5% |
| Somalis | 0.0 /100 | #312 | Tragic 41.5% |
| Jamaicans | 0.0 /100 | #313 | Tragic 41.4% |
| West Indians | 0.0 /100 | #314 | Tragic 41.3% |
| Inupiat | 0.0 /100 | #315 | Tragic 41.3% |
| Immigrants | Caribbean | 0.0 /100 | #316 | Tragic 41.3% |