Alsatian vs Scotch-Irish Currently Married
COMPARE
Alsatian
Scotch-Irish
Currently Married
Currently Married Comparison
Alsatians
Scotch-Irish
45.7%
CURRENTLY MARRIED
10.8/ 100
METRIC RATING
208th/ 347
METRIC RANK
48.7%
CURRENTLY MARRIED
99.3/ 100
METRIC RATING
43rd/ 347
METRIC RANK
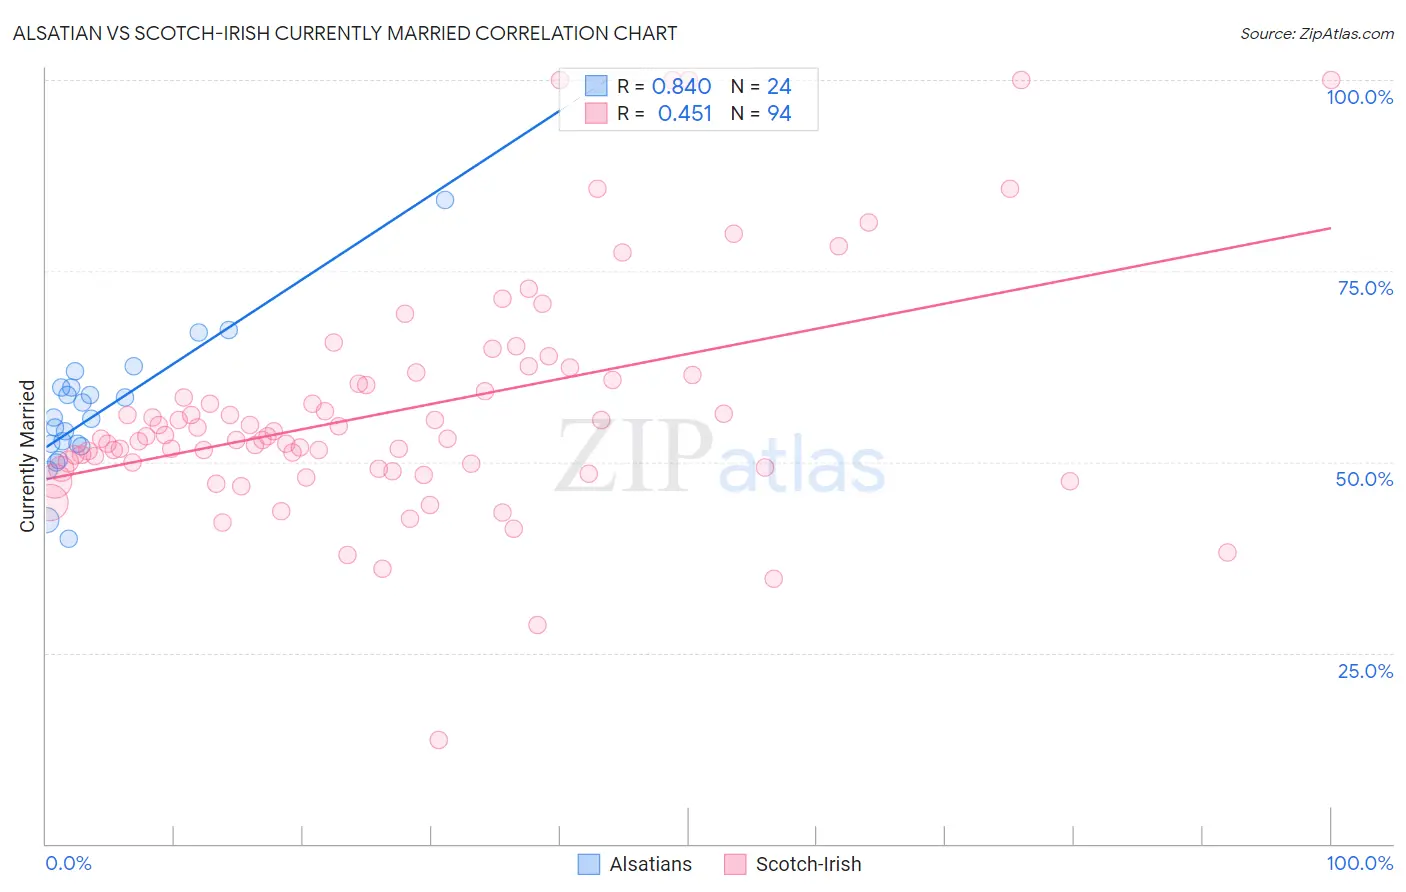
Alsatian vs Scotch-Irish Currently Married Correlation Chart
The statistical analysis conducted on geographies consisting of 82,681,658 people shows a very strong positive correlation between the proportion of Alsatians and percentage of population currently married in the United States with a correlation coefficient (R) of 0.840 and weighted average of 45.7%. Similarly, the statistical analysis conducted on geographies consisting of 548,698,308 people shows a moderate positive correlation between the proportion of Scotch-Irish and percentage of population currently married in the United States with a correlation coefficient (R) of 0.451 and weighted average of 48.7%, a difference of 6.6%.
Currently Married Correlation Summary
| Measurement | Alsatian | Scotch-Irish |
| Minimum | 39.9% | 13.6% |
| Maximum | 84.3% | 100.0% |
| Range | 44.4% | 86.4% |
| Mean | 56.5% | 56.8% |
| Median | 55.7% | 53.2% |
| Interquartile 25% (IQ1) | 52.2% | 49.2% |
| Interquartile 75% (IQ3) | 59.7% | 60.7% |
| Interquartile Range (IQR) | 7.5% | 11.5% |
| Standard Deviation (Sample) | 8.8% | 15.2% |
| Standard Deviation (Population) | 8.6% | 15.1% |
Similar Demographics by Currently Married
Demographics Similar to Alsatians by Currently Married
In terms of currently married, the demographic groups most similar to Alsatians are Immigrants from South America (45.7%, a difference of 0.010%), Immigrants (45.8%, a difference of 0.050%), South American Indian (45.8%, a difference of 0.070%), Immigrants from Spain (45.8%, a difference of 0.080%), and Taiwanese (45.8%, a difference of 0.090%).
| Demographics | Rating | Rank | Currently Married |
| Malaysians | 15.3 /100 | #201 | Poor 45.9% |
| Immigrants | Albania | 14.5 /100 | #202 | Poor 45.9% |
| Taiwanese | 11.7 /100 | #203 | Poor 45.8% |
| Immigrants | Spain | 11.6 /100 | #204 | Poor 45.8% |
| South American Indians | 11.5 /100 | #205 | Poor 45.8% |
| Immigrants | Immigrants | 11.2 /100 | #206 | Poor 45.8% |
| Immigrants | South America | 10.8 /100 | #207 | Poor 45.7% |
| Alsatians | 10.8 /100 | #208 | Poor 45.7% |
| Immigrants | Micronesia | 8.8 /100 | #209 | Tragic 45.6% |
| Uruguayans | 7.9 /100 | #210 | Tragic 45.6% |
| Houma | 7.2 /100 | #211 | Tragic 45.5% |
| Marshallese | 7.2 /100 | #212 | Tragic 45.5% |
| Alaska Natives | 7.0 /100 | #213 | Tragic 45.5% |
| Dutch West Indians | 6.7 /100 | #214 | Tragic 45.5% |
| German Russians | 6.7 /100 | #215 | Tragic 45.5% |
Demographics Similar to Scotch-Irish by Currently Married
In terms of currently married, the demographic groups most similar to Scotch-Irish are Finnish (48.8%, a difference of 0.010%), Immigrants from North America (48.7%, a difference of 0.030%), Greek (48.8%, a difference of 0.050%), Belgian (48.7%, a difference of 0.060%), and Immigrants from Canada (48.8%, a difference of 0.070%).
| Demographics | Rating | Rank | Currently Married |
| Italians | 99.4 /100 | #36 | Exceptional 48.8% |
| Hungarians | 99.4 /100 | #37 | Exceptional 48.8% |
| Czechoslovakians | 99.4 /100 | #38 | Exceptional 48.8% |
| British | 99.4 /100 | #39 | Exceptional 48.8% |
| Immigrants | Canada | 99.4 /100 | #40 | Exceptional 48.8% |
| Greeks | 99.3 /100 | #41 | Exceptional 48.8% |
| Finns | 99.3 /100 | #42 | Exceptional 48.8% |
| Scotch-Irish | 99.3 /100 | #43 | Exceptional 48.7% |
| Immigrants | North America | 99.3 /100 | #44 | Exceptional 48.7% |
| Belgians | 99.3 /100 | #45 | Exceptional 48.7% |
| Immigrants | Iran | 99.2 /100 | #46 | Exceptional 48.7% |
| Northern Europeans | 99.2 /100 | #47 | Exceptional 48.7% |
| Austrians | 99.2 /100 | #48 | Exceptional 48.7% |
| Bhutanese | 99.1 /100 | #49 | Exceptional 48.6% |
| Iranians | 99.0 /100 | #50 | Exceptional 48.6% |