Alsatian vs Immigrants from Barbados Family Households
COMPARE
Alsatian
Immigrants from Barbados
Family Households
Family Households Comparison
Alsatians
Immigrants from Barbados
61.7%
FAMILY HOUSEHOLDS
0.0/ 100
METRIC RATING
321st/ 347
METRIC RANK
63.2%
FAMILY HOUSEHOLDS
0.7/ 100
METRIC RATING
258th/ 347
METRIC RANK
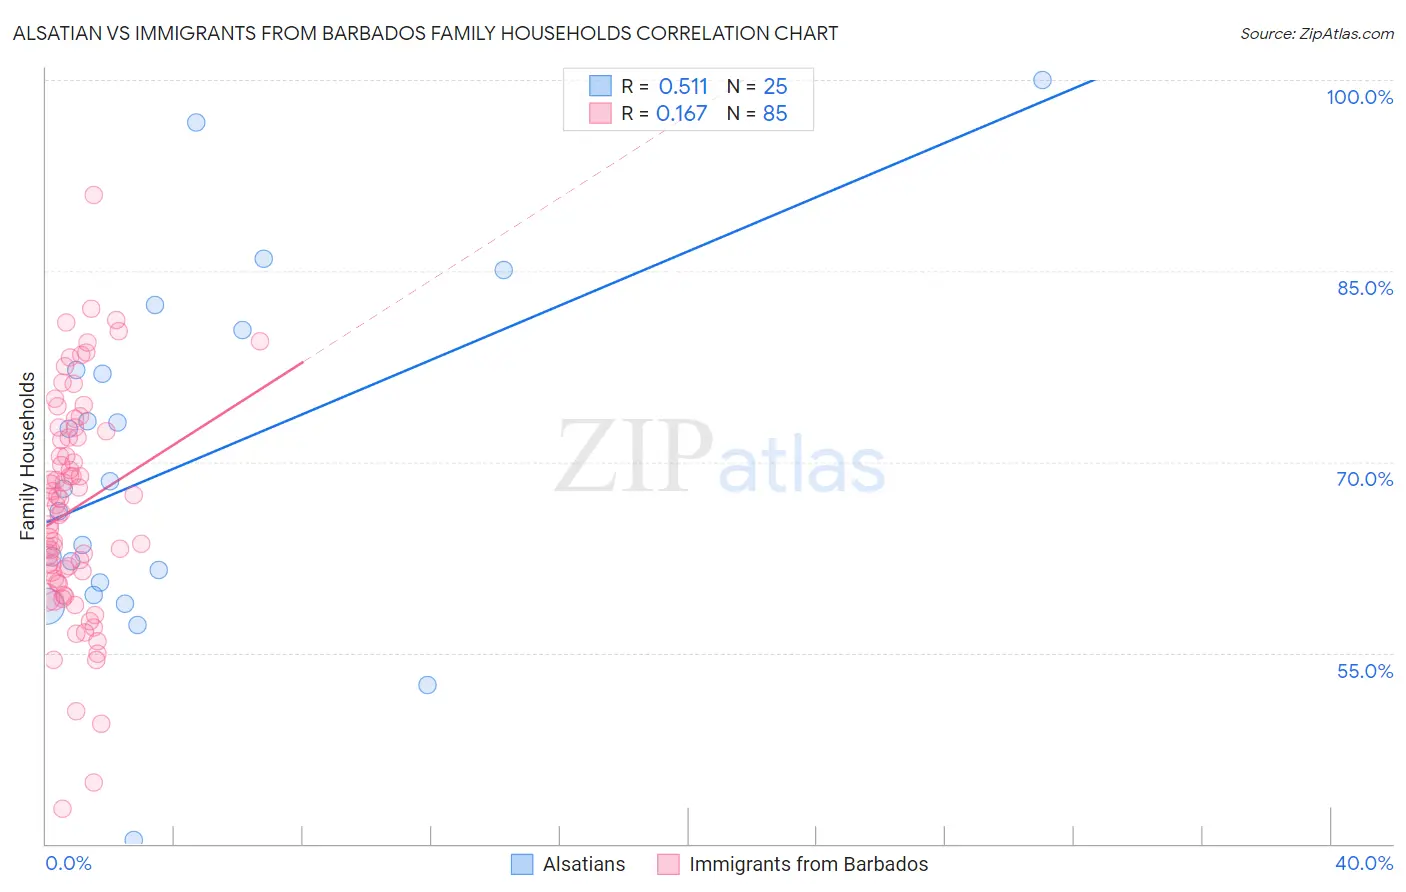
Alsatian vs Immigrants from Barbados Family Households Correlation Chart
The statistical analysis conducted on geographies consisting of 82,680,020 people shows a substantial positive correlation between the proportion of Alsatians and percentage of family households in the United States with a correlation coefficient (R) of 0.511 and weighted average of 61.7%. Similarly, the statistical analysis conducted on geographies consisting of 112,769,646 people shows a poor positive correlation between the proportion of Immigrants from Barbados and percentage of family households in the United States with a correlation coefficient (R) of 0.167 and weighted average of 63.2%, a difference of 2.5%.
Family Households Correlation Summary
| Measurement | Alsatian | Immigrants from Barbados |
| Minimum | 40.3% | 42.7% |
| Maximum | 100.0% | 91.0% |
| Range | 59.7% | 48.2% |
| Mean | 69.7% | 66.3% |
| Median | 67.9% | 66.6% |
| Interquartile 25% (IQ1) | 60.0% | 60.7% |
| Interquartile 75% (IQ3) | 78.8% | 72.2% |
| Interquartile Range (IQR) | 18.7% | 11.5% |
| Standard Deviation (Sample) | 13.7% | 8.7% |
| Standard Deviation (Population) | 13.5% | 8.6% |
Similar Demographics by Family Households
Demographics Similar to Alsatians by Family Households
In terms of family households, the demographic groups most similar to Alsatians are Ugandan (61.7%, a difference of 0.050%), Immigrants from Serbia (61.6%, a difference of 0.090%), Tlingit-Haida (61.6%, a difference of 0.10%), Immigrants from West Indies (61.6%, a difference of 0.10%), and Immigrants from Switzerland (61.6%, a difference of 0.11%).
| Demographics | Rating | Rank | Family Households |
| Immigrants | Cabo Verde | 0.0 /100 | #314 | Tragic 61.9% |
| Moroccans | 0.0 /100 | #315 | Tragic 61.9% |
| Immigrants | Middle Africa | 0.0 /100 | #316 | Tragic 61.9% |
| Immigrants | Bosnia and Herzegovina | 0.0 /100 | #317 | Tragic 61.9% |
| Alaskan Athabascans | 0.0 /100 | #318 | Tragic 61.8% |
| Cape Verdeans | 0.0 /100 | #319 | Tragic 61.8% |
| Ugandans | 0.0 /100 | #320 | Tragic 61.7% |
| Alsatians | 0.0 /100 | #321 | Tragic 61.7% |
| Immigrants | Serbia | 0.0 /100 | #322 | Tragic 61.6% |
| Tlingit-Haida | 0.0 /100 | #323 | Tragic 61.6% |
| Immigrants | West Indies | 0.0 /100 | #324 | Tragic 61.6% |
| Immigrants | Switzerland | 0.0 /100 | #325 | Tragic 61.6% |
| Indonesians | 0.0 /100 | #326 | Tragic 61.5% |
| Blacks/African Americans | 0.0 /100 | #327 | Tragic 61.5% |
| Kiowa | 0.0 /100 | #328 | Tragic 61.4% |
Demographics Similar to Immigrants from Barbados by Family Households
In terms of family households, the demographic groups most similar to Immigrants from Barbados are Immigrants from Western Europe (63.2%, a difference of 0.010%), Cypriot (63.2%, a difference of 0.030%), Immigrants from Russia (63.2%, a difference of 0.050%), Immigrants from Ireland (63.2%, a difference of 0.060%), and Icelander (63.3%, a difference of 0.070%).
| Demographics | Rating | Rank | Family Households |
| Taiwanese | 1.2 /100 | #251 | Tragic 63.3% |
| Bahamians | 1.1 /100 | #252 | Tragic 63.3% |
| Immigrants | Dominican Republic | 1.0 /100 | #253 | Tragic 63.3% |
| Slovaks | 1.0 /100 | #254 | Tragic 63.3% |
| Potawatomi | 1.0 /100 | #255 | Tragic 63.3% |
| Luxembourgers | 0.9 /100 | #256 | Tragic 63.3% |
| Icelanders | 0.8 /100 | #257 | Tragic 63.3% |
| Immigrants | Barbados | 0.7 /100 | #258 | Tragic 63.2% |
| Immigrants | Western Europe | 0.6 /100 | #259 | Tragic 63.2% |
| Cypriots | 0.6 /100 | #260 | Tragic 63.2% |
| Immigrants | Russia | 0.6 /100 | #261 | Tragic 63.2% |
| Immigrants | Ireland | 0.6 /100 | #262 | Tragic 63.2% |
| Cheyenne | 0.5 /100 | #263 | Tragic 63.2% |
| Kenyans | 0.5 /100 | #264 | Tragic 63.2% |
| Colville | 0.5 /100 | #265 | Tragic 63.2% |