Irish vs Immigrants from Trinidad and Tobago Family Households
COMPARE
Irish
Immigrants from Trinidad and Tobago
Family Households
Family Households Comparison
Irish
Immigrants from Trinidad and Tobago
64.4%
FAMILY HOUSEHOLDS
57.9/ 100
METRIC RATING
167th/ 347
METRIC RANK
64.2%
FAMILY HOUSEHOLDS
34.9/ 100
METRIC RATING
181st/ 347
METRIC RANK
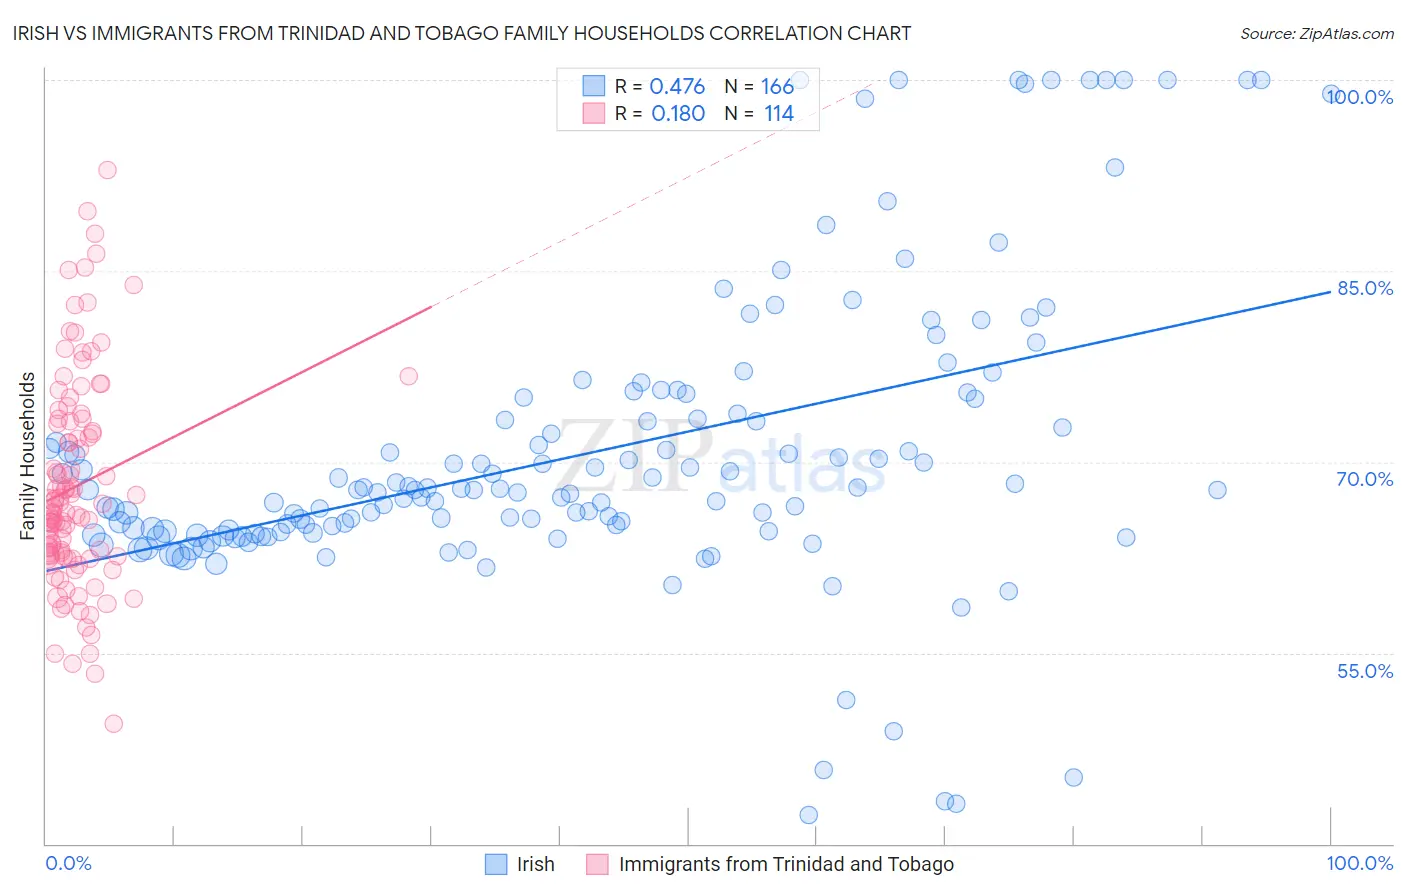
Irish vs Immigrants from Trinidad and Tobago Family Households Correlation Chart
The statistical analysis conducted on geographies consisting of 580,015,491 people shows a moderate positive correlation between the proportion of Irish and percentage of family households in the United States with a correlation coefficient (R) of 0.476 and weighted average of 64.4%. Similarly, the statistical analysis conducted on geographies consisting of 223,484,362 people shows a poor positive correlation between the proportion of Immigrants from Trinidad and Tobago and percentage of family households in the United States with a correlation coefficient (R) of 0.180 and weighted average of 64.2%, a difference of 0.32%.
Family Households Correlation Summary
| Measurement | Irish | Immigrants from Trinidad and Tobago |
| Minimum | 42.2% | 49.5% |
| Maximum | 100.0% | 92.9% |
| Range | 57.8% | 43.4% |
| Mean | 70.7% | 68.1% |
| Median | 67.8% | 66.5% |
| Interquartile 25% (IQ1) | 64.5% | 62.6% |
| Interquartile 75% (IQ3) | 73.8% | 73.2% |
| Interquartile Range (IQR) | 9.3% | 10.5% |
| Standard Deviation (Sample) | 11.6% | 8.3% |
| Standard Deviation (Population) | 11.5% | 8.2% |
Demographics Similar to Irish and Immigrants from Trinidad and Tobago by Family Households
In terms of family households, the demographic groups most similar to Irish are Honduran (64.4%, a difference of 0.010%), Scotch-Irish (64.4%, a difference of 0.020%), Immigrants from Nigeria (64.4%, a difference of 0.030%), Immigrants from Southern Europe (64.4%, a difference of 0.030%), and Iraqi (64.4%, a difference of 0.030%). Similarly, the demographic groups most similar to Immigrants from Trinidad and Tobago are Immigrants from Honduras (64.2%, a difference of 0.0%), Ukrainian (64.2%, a difference of 0.0%), Creek (64.2%, a difference of 0.010%), Puerto Rican (64.2%, a difference of 0.020%), and Immigrants from Ukraine (64.2%, a difference of 0.050%).
| Demographics | Rating | Rank | Family Households |
| Immigrants | Nigeria | 60.1 /100 | #164 | Good 64.4% |
| Immigrants | Southern Europe | 60.0 /100 | #165 | Good 64.4% |
| Scotch-Irish | 59.2 /100 | #166 | Average 64.4% |
| Irish | 57.9 /100 | #167 | Average 64.4% |
| Hondurans | 57.5 /100 | #168 | Average 64.4% |
| Iraqis | 56.0 /100 | #169 | Average 64.4% |
| Armenians | 55.9 /100 | #170 | Average 64.4% |
| Ute | 54.6 /100 | #171 | Average 64.3% |
| Dutch West Indians | 53.9 /100 | #172 | Average 64.3% |
| Immigrants | Sierra Leone | 52.5 /100 | #173 | Average 64.3% |
| Immigrants | Germany | 50.0 /100 | #174 | Average 64.3% |
| Bangladeshis | 44.3 /100 | #175 | Average 64.3% |
| Vietnamese | 43.6 /100 | #176 | Average 64.2% |
| Immigrants | Micronesia | 42.3 /100 | #177 | Average 64.2% |
| Jamaicans | 40.6 /100 | #178 | Average 64.2% |
| Immigrants | Ukraine | 38.2 /100 | #179 | Fair 64.2% |
| Immigrants | Honduras | 35.0 /100 | #180 | Fair 64.2% |
| Immigrants | Trinidad and Tobago | 34.9 /100 | #181 | Fair 64.2% |
| Ukrainians | 34.6 /100 | #182 | Fair 64.2% |
| Creek | 34.1 /100 | #183 | Fair 64.2% |
| Puerto Ricans | 33.4 /100 | #184 | Fair 64.2% |