Alaskan Athabascan vs Immigrants from Trinidad and Tobago Nursery School
COMPARE
Alaskan Athabascan
Immigrants from Trinidad and Tobago
Nursery School
Nursery School Comparison
Alaskan Athabascans
Immigrants from Trinidad and Tobago
98.8%
NURSERY SCHOOL
100.0/ 100
METRIC RATING
6th/ 347
METRIC RANK
97.4%
NURSERY SCHOOL
0.0/ 100
METRIC RATING
284th/ 347
METRIC RANK
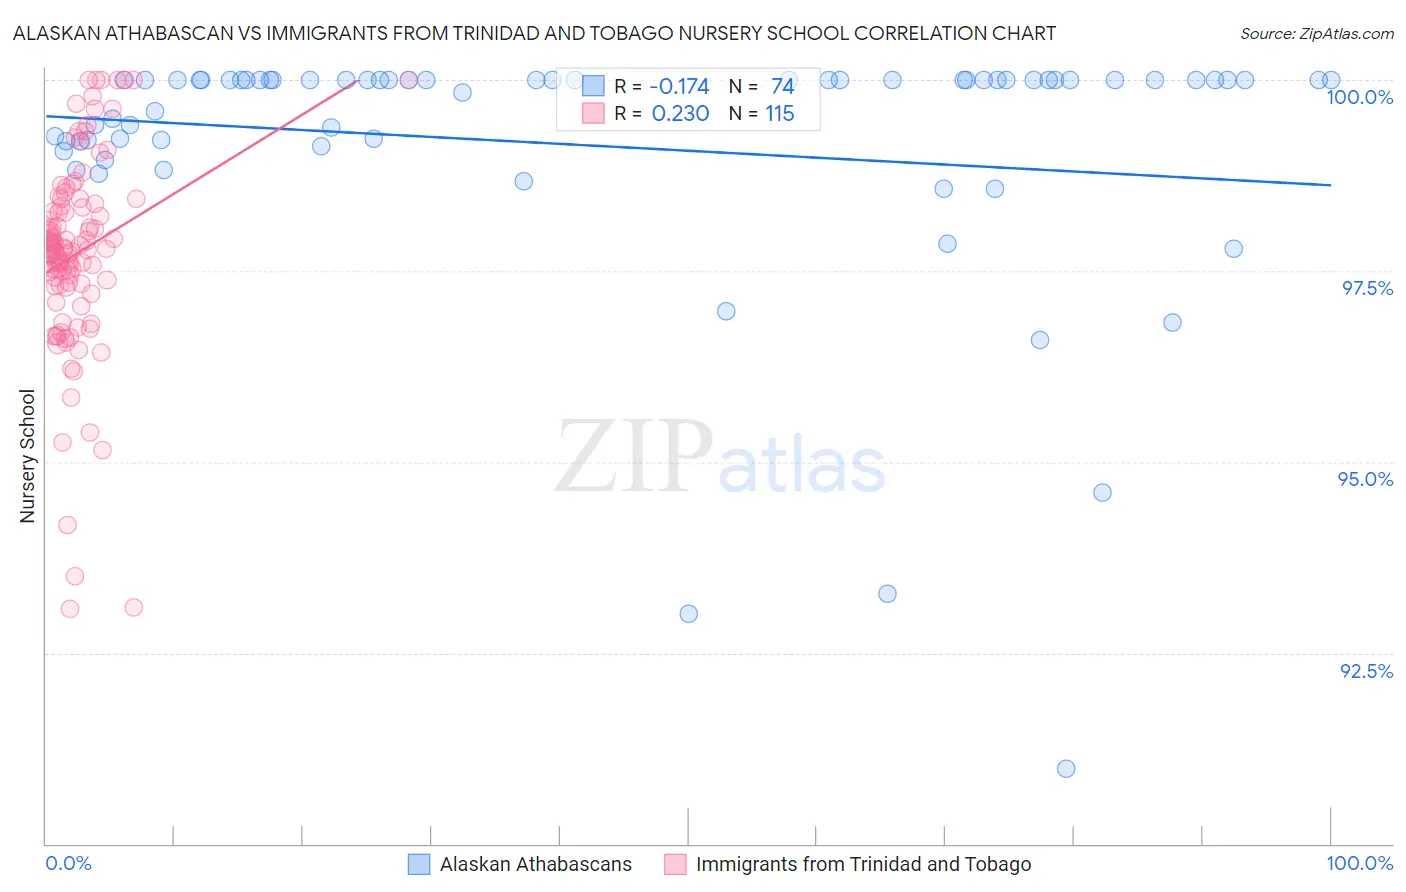
Alaskan Athabascan vs Immigrants from Trinidad and Tobago Nursery School Correlation Chart
The statistical analysis conducted on geographies consisting of 45,820,365 people shows a poor negative correlation between the proportion of Alaskan Athabascans and percentage of population with at least nursery school education in the United States with a correlation coefficient (R) of -0.174 and weighted average of 98.8%. Similarly, the statistical analysis conducted on geographies consisting of 223,545,304 people shows a weak positive correlation between the proportion of Immigrants from Trinidad and Tobago and percentage of population with at least nursery school education in the United States with a correlation coefficient (R) of 0.230 and weighted average of 97.4%, a difference of 1.5%.
Nursery School Correlation Summary
| Measurement | Alaskan Athabascan | Immigrants from Trinidad and Tobago |
| Minimum | 91.0% | 93.1% |
| Maximum | 100.0% | 100.0% |
| Range | 9.0% | 6.9% |
| Mean | 99.1% | 97.7% |
| Median | 100.0% | 97.8% |
| Interquartile 25% (IQ1) | 99.1% | 97.3% |
| Interquartile 75% (IQ3) | 100.0% | 98.4% |
| Interquartile Range (IQR) | 0.87% | 1.1% |
| Standard Deviation (Sample) | 1.7% | 1.3% |
| Standard Deviation (Population) | 1.7% | 1.3% |
Similar Demographics by Nursery School
Demographics Similar to Alaskan Athabascans by Nursery School
In terms of nursery school, the demographic groups most similar to Alaskan Athabascans are Alaska Native (98.8%, a difference of 0.030%), Norwegian (98.7%, a difference of 0.060%), Tsimshian (98.9%, a difference of 0.070%), Slovak (98.7%, a difference of 0.070%), and German (98.7%, a difference of 0.070%).
| Demographics | Rating | Rank | Nursery School |
| Crow | 100.0 /100 | #1 | Exceptional 99.7% |
| Yup'ik | 100.0 /100 | #2 | Exceptional 99.2% |
| Welsh | 100.0 /100 | #3 | Exceptional 98.9% |
| Inupiat | 100.0 /100 | #4 | Exceptional 98.9% |
| Tsimshian | 100.0 /100 | #5 | Exceptional 98.9% |
| Alaskan Athabascans | 100.0 /100 | #6 | Exceptional 98.8% |
| Alaska Natives | 100.0 /100 | #7 | Exceptional 98.8% |
| Norwegians | 100.0 /100 | #8 | Exceptional 98.7% |
| Slovaks | 100.0 /100 | #9 | Exceptional 98.7% |
| Germans | 100.0 /100 | #10 | Exceptional 98.7% |
| Tlingit-Haida | 100.0 /100 | #11 | Exceptional 98.7% |
| Slovenes | 100.0 /100 | #12 | Exceptional 98.7% |
| English | 100.0 /100 | #13 | Exceptional 98.7% |
| Carpatho Rusyns | 100.0 /100 | #14 | Exceptional 98.7% |
| Swedes | 100.0 /100 | #15 | Exceptional 98.7% |
Demographics Similar to Immigrants from Trinidad and Tobago by Nursery School
In terms of nursery school, the demographic groups most similar to Immigrants from Trinidad and Tobago are Immigrants from West Indies (97.4%, a difference of 0.0%), Immigrants from Barbados (97.4%, a difference of 0.020%), Immigrants from Portugal (97.4%, a difference of 0.020%), Immigrants from Hong Kong (97.4%, a difference of 0.030%), and Barbadian (97.4%, a difference of 0.040%).
| Demographics | Rating | Rank | Nursery School |
| Immigrants | Western Africa | 0.1 /100 | #277 | Tragic 97.4% |
| Immigrants | Uzbekistan | 0.1 /100 | #278 | Tragic 97.4% |
| Immigrants | Ghana | 0.1 /100 | #279 | Tragic 97.4% |
| Barbadians | 0.0 /100 | #280 | Tragic 97.4% |
| Trinidadians and Tobagonians | 0.0 /100 | #281 | Tragic 97.4% |
| Afghans | 0.0 /100 | #282 | Tragic 97.4% |
| Immigrants | West Indies | 0.0 /100 | #283 | Tragic 97.4% |
| Immigrants | Trinidad and Tobago | 0.0 /100 | #284 | Tragic 97.4% |
| Immigrants | Barbados | 0.0 /100 | #285 | Tragic 97.4% |
| Immigrants | Portugal | 0.0 /100 | #286 | Tragic 97.4% |
| Immigrants | Hong Kong | 0.0 /100 | #287 | Tragic 97.4% |
| Immigrants | Thailand | 0.0 /100 | #288 | Tragic 97.3% |
| Immigrants | St. Vincent and the Grenadines | 0.0 /100 | #289 | Tragic 97.3% |
| Immigrants | Afghanistan | 0.0 /100 | #290 | Tragic 97.3% |
| British West Indians | 0.0 /100 | #291 | Tragic 97.3% |