Alaskan Athabascan vs Immigrants from Trinidad and Tobago Median Household Income
COMPARE
Alaskan Athabascan
Immigrants from Trinidad and Tobago
Median Household Income
Median Household Income Comparison
Alaskan Athabascans
Immigrants from Trinidad and Tobago
$76,383
MEDIAN HOUSEHOLD INCOME
0.4/ 100
METRIC RATING
263rd/ 347
METRIC RANK
$80,373
MEDIAN HOUSEHOLD INCOME
4.6/ 100
METRIC RATING
232nd/ 347
METRIC RANK
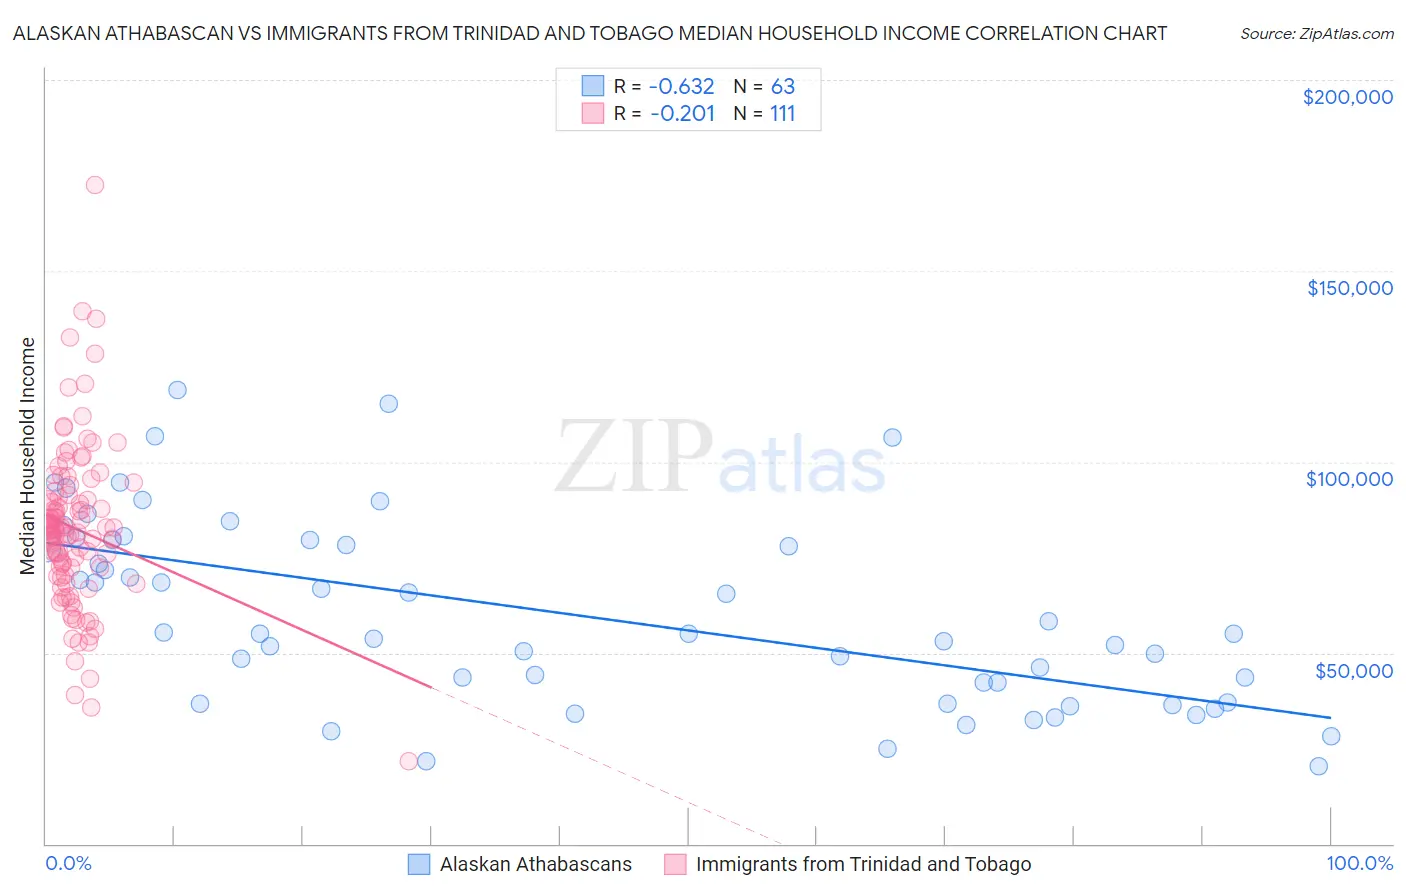
Alaskan Athabascan vs Immigrants from Trinidad and Tobago Median Household Income Correlation Chart
The statistical analysis conducted on geographies consisting of 45,812,420 people shows a significant negative correlation between the proportion of Alaskan Athabascans and median household income in the United States with a correlation coefficient (R) of -0.632 and weighted average of $76,383. Similarly, the statistical analysis conducted on geographies consisting of 223,468,612 people shows a weak negative correlation between the proportion of Immigrants from Trinidad and Tobago and median household income in the United States with a correlation coefficient (R) of -0.201 and weighted average of $80,373, a difference of 5.2%.
Median Household Income Correlation Summary
| Measurement | Alaskan Athabascan | Immigrants from Trinidad and Tobago |
| Minimum | $20,417 | $21,629 |
| Maximum | $118,934 | $172,500 |
| Range | $98,517 | $150,871 |
| Mean | $60,171 | $82,579 |
| Median | $55,000 | $82,052 |
| Interquartile 25% (IQ1) | $36,964 | $70,433 |
| Interquartile 75% (IQ3) | $79,438 | $91,223 |
| Interquartile Range (IQR) | $42,474 | $20,791 |
| Standard Deviation (Sample) | $24,397 | $21,636 |
| Standard Deviation (Population) | $24,203 | $21,539 |
Similar Demographics by Median Household Income
Demographics Similar to Alaskan Athabascans by Median Household Income
In terms of median household income, the demographic groups most similar to Alaskan Athabascans are French American Indian ($76,387, a difference of 0.010%), Immigrants from Grenada ($76,517, a difference of 0.18%), Jamaican ($76,583, a difference of 0.26%), Spanish American Indian ($76,670, a difference of 0.38%), and Immigrants from Nicaragua ($76,784, a difference of 0.52%).
| Demographics | Rating | Rank | Median Household Income |
| Belizeans | 0.6 /100 | #256 | Tragic $77,028 |
| Immigrants | Senegal | 0.5 /100 | #257 | Tragic $76,915 |
| Immigrants | Nicaragua | 0.5 /100 | #258 | Tragic $76,784 |
| Spanish American Indians | 0.4 /100 | #259 | Tragic $76,670 |
| Jamaicans | 0.4 /100 | #260 | Tragic $76,583 |
| Immigrants | Grenada | 0.4 /100 | #261 | Tragic $76,517 |
| French American Indians | 0.4 /100 | #262 | Tragic $76,387 |
| Alaskan Athabascans | 0.4 /100 | #263 | Tragic $76,383 |
| Guatemalans | 0.3 /100 | #264 | Tragic $75,961 |
| Immigrants | Belize | 0.3 /100 | #265 | Tragic $75,938 |
| Americans | 0.3 /100 | #266 | Tragic $75,932 |
| German Russians | 0.3 /100 | #267 | Tragic $75,856 |
| Immigrants | Jamaica | 0.3 /100 | #268 | Tragic $75,851 |
| Cape Verdeans | 0.3 /100 | #269 | Tragic $75,848 |
| Hmong | 0.3 /100 | #270 | Tragic $75,839 |
Demographics Similar to Immigrants from Trinidad and Tobago by Median Household Income
In terms of median household income, the demographic groups most similar to Immigrants from Trinidad and Tobago are Immigrants from the Azores ($80,357, a difference of 0.020%), Bermudan ($80,406, a difference of 0.040%), Trinidadian and Tobagonian ($80,402, a difference of 0.040%), Immigrants from Ecuador ($80,341, a difference of 0.040%), and Immigrants from Guyana ($80,324, a difference of 0.060%).
| Demographics | Rating | Rank | Median Household Income |
| Scotch-Irish | 6.6 /100 | #225 | Tragic $80,972 |
| Immigrants | Panama | 6.2 /100 | #226 | Tragic $80,873 |
| Guyanese | 5.7 /100 | #227 | Tragic $80,734 |
| Immigrants | Bangladesh | 5.7 /100 | #228 | Tragic $80,722 |
| Delaware | 5.0 /100 | #229 | Tragic $80,527 |
| Bermudans | 4.7 /100 | #230 | Tragic $80,406 |
| Trinidadians and Tobagonians | 4.7 /100 | #231 | Tragic $80,402 |
| Immigrants | Trinidad and Tobago | 4.6 /100 | #232 | Tragic $80,373 |
| Immigrants | Azores | 4.5 /100 | #233 | Tragic $80,357 |
| Immigrants | Ecuador | 4.5 /100 | #234 | Tragic $80,341 |
| Immigrants | Guyana | 4.5 /100 | #235 | Tragic $80,324 |
| Immigrants | Bosnia and Herzegovina | 3.4 /100 | #236 | Tragic $79,888 |
| Nicaraguans | 3.1 /100 | #237 | Tragic $79,737 |
| Barbadians | 3.0 /100 | #238 | Tragic $79,664 |
| Alaska Natives | 2.7 /100 | #239 | Tragic $79,509 |