Alaskan Athabascan vs Immigrants from Micronesia 5th Grade
COMPARE
Alaskan Athabascan
Immigrants from Micronesia
5th Grade
5th Grade Comparison
Alaskan Athabascans
Immigrants from Micronesia
98.3%
5TH GRADE
100.0/ 100
METRIC RATING
11th/ 347
METRIC RANK
97.3%
5TH GRADE
48.8/ 100
METRIC RATING
175th/ 347
METRIC RANK
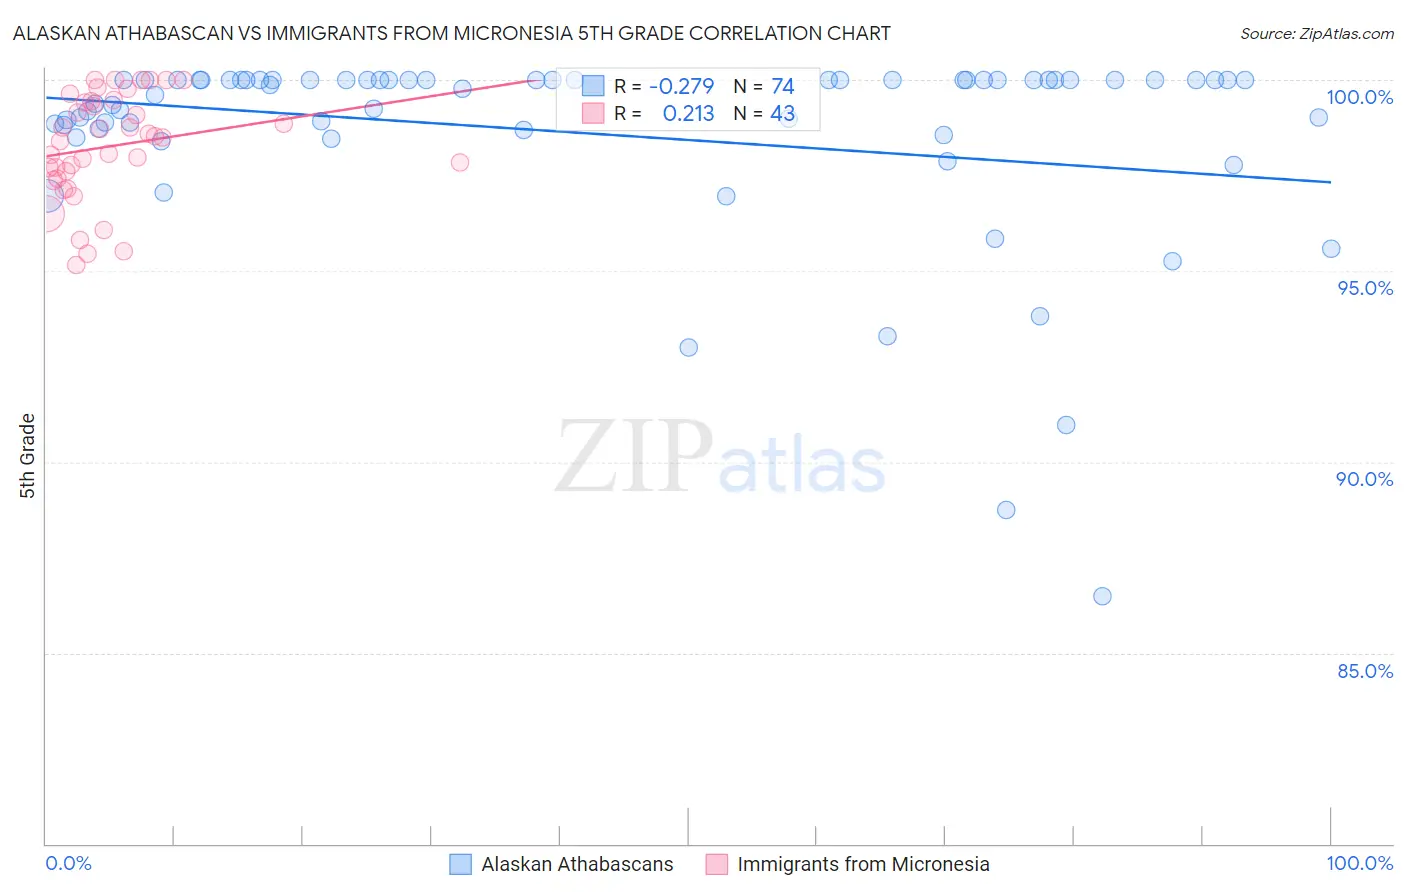
Alaskan Athabascan vs Immigrants from Micronesia 5th Grade Correlation Chart
The statistical analysis conducted on geographies consisting of 45,820,365 people shows a weak negative correlation between the proportion of Alaskan Athabascans and percentage of population with at least 5th grade education in the United States with a correlation coefficient (R) of -0.279 and weighted average of 98.3%. Similarly, the statistical analysis conducted on geographies consisting of 61,604,657 people shows a weak positive correlation between the proportion of Immigrants from Micronesia and percentage of population with at least 5th grade education in the United States with a correlation coefficient (R) of 0.213 and weighted average of 97.3%, a difference of 1.0%.
5th Grade Correlation Summary
| Measurement | Alaskan Athabascan | Immigrants from Micronesia |
| Minimum | 86.5% | 95.2% |
| Maximum | 100.0% | 100.0% |
| Range | 13.5% | 4.8% |
| Mean | 98.6% | 98.3% |
| Median | 99.9% | 98.5% |
| Interquartile 25% (IQ1) | 98.7% | 97.4% |
| Interquartile 75% (IQ3) | 100.0% | 99.4% |
| Interquartile Range (IQR) | 1.3% | 2.0% |
| Standard Deviation (Sample) | 2.6% | 1.4% |
| Standard Deviation (Population) | 2.6% | 1.4% |
Similar Demographics by 5th Grade
Demographics Similar to Alaskan Athabascans by 5th Grade
In terms of 5th grade, the demographic groups most similar to Alaskan Athabascans are Swedish (98.3%, a difference of 0.0%), English (98.3%, a difference of 0.0%), Carpatho Rusyn (98.3%, a difference of 0.010%), Tlingit-Haida (98.3%, a difference of 0.020%), and Dutch (98.3%, a difference of 0.030%).
| Demographics | Rating | Rank | 5th Grade |
| Tsimshian | 100.0 /100 | #4 | Exceptional 98.4% |
| Slovaks | 100.0 /100 | #5 | Exceptional 98.4% |
| Germans | 100.0 /100 | #6 | Exceptional 98.4% |
| Inupiat | 100.0 /100 | #7 | Exceptional 98.4% |
| Slovenes | 100.0 /100 | #8 | Exceptional 98.3% |
| Swedes | 100.0 /100 | #9 | Exceptional 98.3% |
| English | 100.0 /100 | #10 | Exceptional 98.3% |
| Alaskan Athabascans | 100.0 /100 | #11 | Exceptional 98.3% |
| Carpatho Rusyns | 100.0 /100 | #12 | Exceptional 98.3% |
| Tlingit-Haida | 100.0 /100 | #13 | Exceptional 98.3% |
| Dutch | 100.0 /100 | #14 | Exceptional 98.3% |
| Scottish | 100.0 /100 | #15 | Exceptional 98.3% |
| Poles | 100.0 /100 | #16 | Exceptional 98.3% |
| Irish | 100.0 /100 | #17 | Exceptional 98.3% |
| Pennsylvania Germans | 100.0 /100 | #18 | Exceptional 98.3% |
Demographics Similar to Immigrants from Micronesia by 5th Grade
In terms of 5th grade, the demographic groups most similar to Immigrants from Micronesia are Immigrants from Taiwan (97.3%, a difference of 0.0%), Egyptian (97.3%, a difference of 0.010%), Immigrants from Kazakhstan (97.3%, a difference of 0.010%), Immigrants from Spain (97.3%, a difference of 0.010%), and Chilean (97.3%, a difference of 0.020%).
| Demographics | Rating | Rank | 5th Grade |
| Chileans | 54.5 /100 | #168 | Average 97.3% |
| Immigrants | Korea | 54.1 /100 | #169 | Average 97.3% |
| Venezuelans | 54.0 /100 | #170 | Average 97.3% |
| Immigrants | Sri Lanka | 53.8 /100 | #171 | Average 97.3% |
| Arabs | 53.4 /100 | #172 | Average 97.3% |
| Egyptians | 52.4 /100 | #173 | Average 97.3% |
| Immigrants | Kazakhstan | 50.0 /100 | #174 | Average 97.3% |
| Immigrants | Micronesia | 48.8 /100 | #175 | Average 97.3% |
| Immigrants | Taiwan | 48.4 /100 | #176 | Average 97.3% |
| Immigrants | Spain | 47.0 /100 | #177 | Average 97.3% |
| Comanche | 42.1 /100 | #178 | Average 97.3% |
| Immigrants | Kenya | 40.3 /100 | #179 | Average 97.3% |
| Pakistanis | 40.2 /100 | #180 | Average 97.3% |
| Argentineans | 39.5 /100 | #181 | Fair 97.3% |
| Mongolians | 39.4 /100 | #182 | Fair 97.3% |