Alaskan Athabascan vs Immigrants from Kuwait 9th Grade
COMPARE
Alaskan Athabascan
Immigrants from Kuwait
9th Grade
9th Grade Comparison
Alaskan Athabascans
Immigrants from Kuwait
96.4%
9TH GRADE
100.0/ 100
METRIC RATING
21st/ 347
METRIC RANK
95.4%
9TH GRADE
95.5/ 100
METRIC RATING
122nd/ 347
METRIC RANK
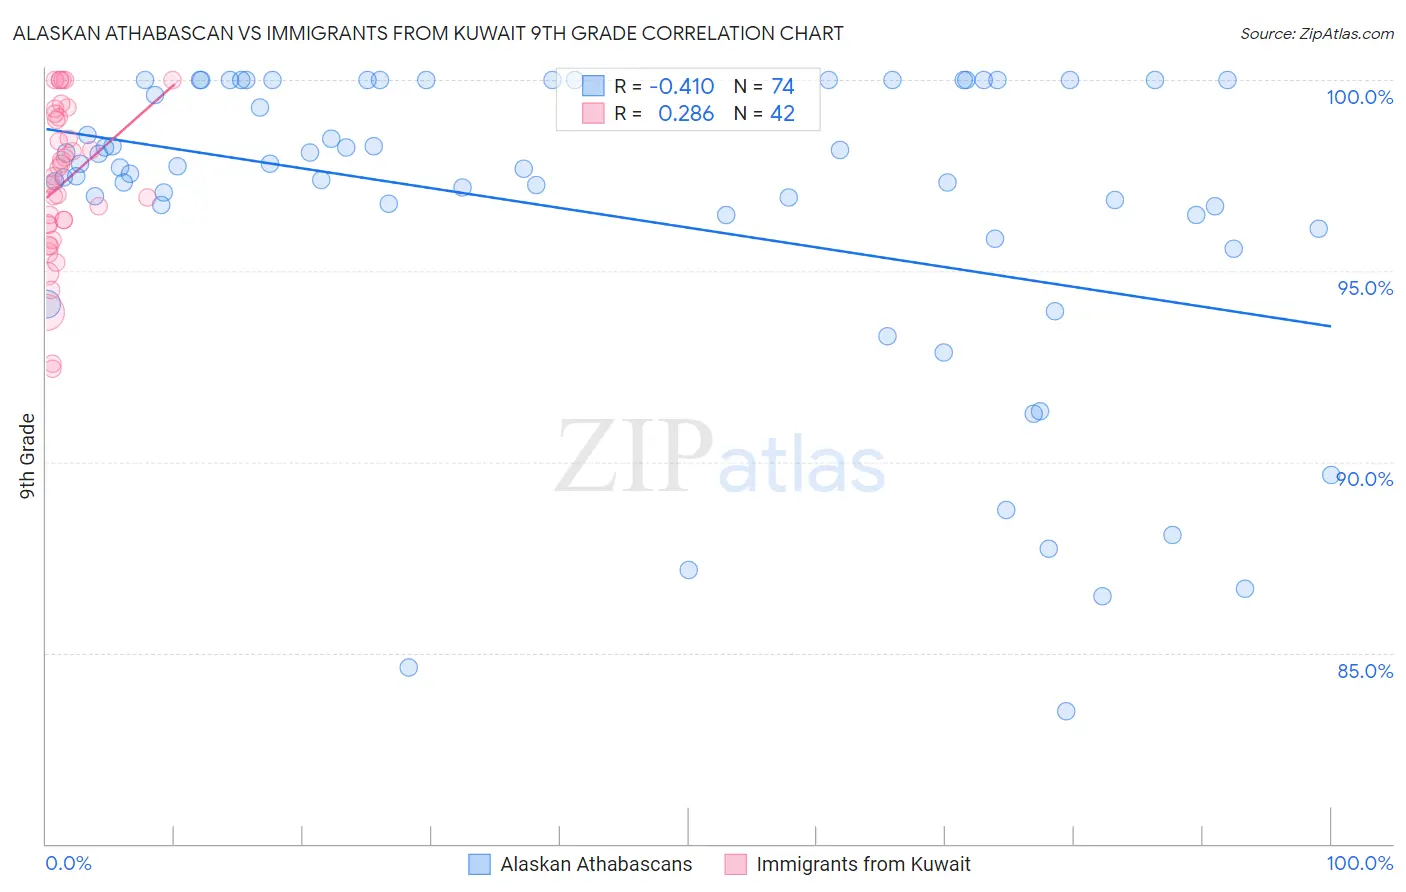
Alaskan Athabascan vs Immigrants from Kuwait 9th Grade Correlation Chart
The statistical analysis conducted on geographies consisting of 45,820,365 people shows a moderate negative correlation between the proportion of Alaskan Athabascans and percentage of population with at least 9th grade education in the United States with a correlation coefficient (R) of -0.410 and weighted average of 96.4%. Similarly, the statistical analysis conducted on geographies consisting of 136,913,666 people shows a weak positive correlation between the proportion of Immigrants from Kuwait and percentage of population with at least 9th grade education in the United States with a correlation coefficient (R) of 0.286 and weighted average of 95.4%, a difference of 1.0%.
9th Grade Correlation Summary
| Measurement | Alaskan Athabascan | Immigrants from Kuwait |
| Minimum | 83.5% | 92.5% |
| Maximum | 100.0% | 100.0% |
| Range | 16.5% | 7.5% |
| Mean | 96.5% | 97.3% |
| Median | 97.7% | 97.4% |
| Interquartile 25% (IQ1) | 96.4% | 96.2% |
| Interquartile 75% (IQ3) | 100.0% | 99.0% |
| Interquartile Range (IQR) | 3.6% | 2.8% |
| Standard Deviation (Sample) | 4.2% | 2.0% |
| Standard Deviation (Population) | 4.1% | 2.0% |
Similar Demographics by 9th Grade
Demographics Similar to Alaskan Athabascans by 9th Grade
In terms of 9th grade, the demographic groups most similar to Alaskan Athabascans are Italian (96.4%, a difference of 0.010%), European (96.4%, a difference of 0.010%), Welsh (96.4%, a difference of 0.020%), Czech (96.4%, a difference of 0.020%), and Scandinavian (96.5%, a difference of 0.050%).
| Demographics | Rating | Rank | 9th Grade |
| Scottish | 100.0 /100 | #14 | Exceptional 96.5% |
| Irish | 100.0 /100 | #15 | Exceptional 96.5% |
| Croatians | 100.0 /100 | #16 | Exceptional 96.5% |
| Dutch | 100.0 /100 | #17 | Exceptional 96.5% |
| Scandinavians | 100.0 /100 | #18 | Exceptional 96.5% |
| Welsh | 100.0 /100 | #19 | Exceptional 96.4% |
| Italians | 100.0 /100 | #20 | Exceptional 96.4% |
| Alaskan Athabascans | 100.0 /100 | #21 | Exceptional 96.4% |
| Europeans | 100.0 /100 | #22 | Exceptional 96.4% |
| Czechs | 100.0 /100 | #23 | Exceptional 96.4% |
| Latvians | 100.0 /100 | #24 | Exceptional 96.4% |
| French | 100.0 /100 | #25 | Exceptional 96.3% |
| French Canadians | 100.0 /100 | #26 | Exceptional 96.3% |
| Scotch-Irish | 100.0 /100 | #27 | Exceptional 96.3% |
| Eastern Europeans | 100.0 /100 | #28 | Exceptional 96.3% |
Demographics Similar to Immigrants from Kuwait by 9th Grade
In terms of 9th grade, the demographic groups most similar to Immigrants from Kuwait are Immigrants from Romania (95.4%, a difference of 0.0%), Immigrants from Turkey (95.4%, a difference of 0.0%), Soviet Union (95.4%, a difference of 0.0%), Cambodian (95.4%, a difference of 0.0%), and Cree (95.4%, a difference of 0.0%).
| Demographics | Rating | Rank | 9th Grade |
| Burmese | 96.0 /100 | #115 | Exceptional 95.4% |
| Immigrants | Europe | 95.7 /100 | #116 | Exceptional 95.4% |
| Immigrants | Romania | 95.6 /100 | #117 | Exceptional 95.4% |
| Immigrants | Turkey | 95.6 /100 | #118 | Exceptional 95.4% |
| Soviet Union | 95.6 /100 | #119 | Exceptional 95.4% |
| Cambodians | 95.6 /100 | #120 | Exceptional 95.4% |
| Cree | 95.5 /100 | #121 | Exceptional 95.4% |
| Immigrants | Kuwait | 95.5 /100 | #122 | Exceptional 95.4% |
| Kiowa | 95.3 /100 | #123 | Exceptional 95.4% |
| Shoshone | 95.3 /100 | #124 | Exceptional 95.4% |
| Immigrants | South Central Asia | 95.1 /100 | #125 | Exceptional 95.4% |
| Immigrants | Serbia | 94.4 /100 | #126 | Exceptional 95.4% |
| Palestinians | 94.3 /100 | #127 | Exceptional 95.4% |
| Immigrants | Hungary | 94.2 /100 | #128 | Exceptional 95.4% |
| Basques | 94.1 /100 | #129 | Exceptional 95.4% |