Liberian vs Immigrants from Kuwait Family Households
COMPARE
Liberian
Immigrants from Kuwait
Family Households
Family Households Comparison
Liberians
Immigrants from Kuwait
62.0%
FAMILY HOUSEHOLDS
0.0/ 100
METRIC RATING
313th/ 347
METRIC RANK
62.4%
FAMILY HOUSEHOLDS
0.0/ 100
METRIC RATING
299th/ 347
METRIC RANK
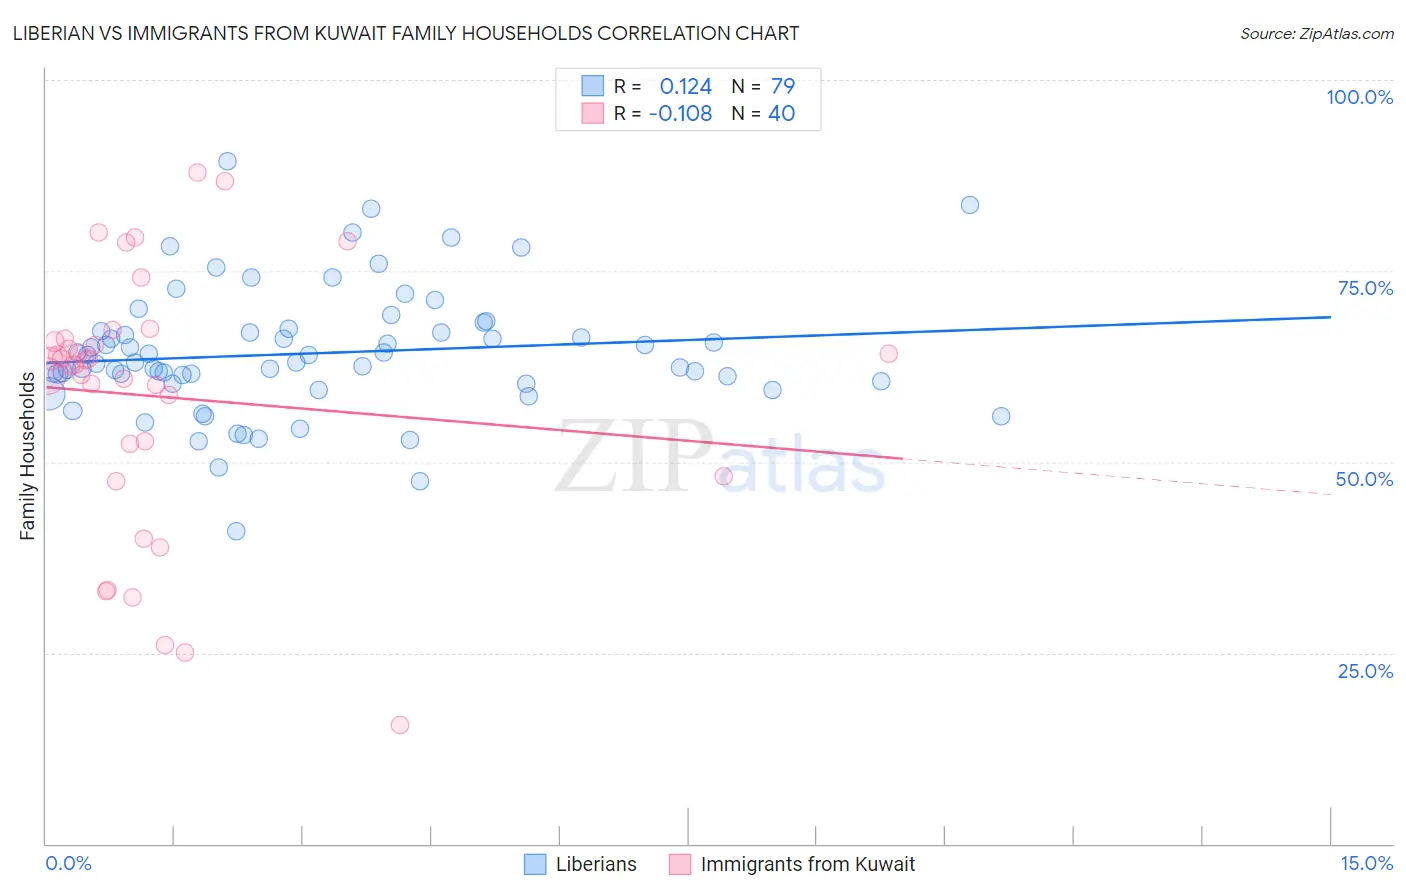
Liberian vs Immigrants from Kuwait Family Households Correlation Chart
The statistical analysis conducted on geographies consisting of 118,040,608 people shows a poor positive correlation between the proportion of Liberians and percentage of family households in the United States with a correlation coefficient (R) of 0.124 and weighted average of 62.0%. Similarly, the statistical analysis conducted on geographies consisting of 136,888,250 people shows a poor negative correlation between the proportion of Immigrants from Kuwait and percentage of family households in the United States with a correlation coefficient (R) of -0.108 and weighted average of 62.4%, a difference of 0.66%.
Family Households Correlation Summary
| Measurement | Liberian | Immigrants from Kuwait |
| Minimum | 40.9% | 15.6% |
| Maximum | 89.4% | 87.9% |
| Range | 48.5% | 72.2% |
| Mean | 64.2% | 58.5% |
| Median | 63.0% | 63.0% |
| Interquartile 25% (IQ1) | 60.3% | 50.2% |
| Interquartile 75% (IQ3) | 67.1% | 66.0% |
| Interquartile Range (IQR) | 6.8% | 15.8% |
| Standard Deviation (Sample) | 8.3% | 17.0% |
| Standard Deviation (Population) | 8.3% | 16.8% |
Demographics Similar to Liberians and Immigrants from Kuwait by Family Households
In terms of family households, the demographic groups most similar to Liberians are Immigrants from Latvia (62.0%, a difference of 0.010%), Immigrants from Morocco (62.0%, a difference of 0.050%), Immigrants from Cabo Verde (61.9%, a difference of 0.050%), Immigrants from Liberia (62.0%, a difference of 0.080%), and Moroccan (61.9%, a difference of 0.090%). Similarly, the demographic groups most similar to Immigrants from Kuwait are Immigrants from Africa (62.4%, a difference of 0.0%), Immigrants from Albania (62.4%, a difference of 0.030%), Immigrants from Spain (62.4%, a difference of 0.060%), Immigrants from Kenya (62.3%, a difference of 0.070%), and French American Indian (62.4%, a difference of 0.090%).
| Demographics | Rating | Rank | Family Households |
| Slovenes | 0.0 /100 | #296 | Tragic 62.4% |
| French American Indians | 0.0 /100 | #297 | Tragic 62.4% |
| Immigrants | Spain | 0.0 /100 | #298 | Tragic 62.4% |
| Immigrants | Kuwait | 0.0 /100 | #299 | Tragic 62.4% |
| Immigrants | Africa | 0.0 /100 | #300 | Tragic 62.4% |
| Immigrants | Albania | 0.0 /100 | #301 | Tragic 62.4% |
| Immigrants | Kenya | 0.0 /100 | #302 | Tragic 62.3% |
| Cree | 0.0 /100 | #303 | Tragic 62.3% |
| Iroquois | 0.0 /100 | #304 | Tragic 62.2% |
| Bermudans | 0.0 /100 | #305 | Tragic 62.2% |
| Africans | 0.0 /100 | #306 | Tragic 62.1% |
| Immigrants | Norway | 0.0 /100 | #307 | Tragic 62.1% |
| Chippewa | 0.0 /100 | #308 | Tragic 62.1% |
| Sub-Saharan Africans | 0.0 /100 | #309 | Tragic 62.1% |
| Immigrants | Liberia | 0.0 /100 | #310 | Tragic 62.0% |
| Immigrants | Morocco | 0.0 /100 | #311 | Tragic 62.0% |
| Immigrants | Latvia | 0.0 /100 | #312 | Tragic 62.0% |
| Liberians | 0.0 /100 | #313 | Tragic 62.0% |
| Immigrants | Cabo Verde | 0.0 /100 | #314 | Tragic 61.9% |
| Moroccans | 0.0 /100 | #315 | Tragic 61.9% |
| Immigrants | Middle Africa | 0.0 /100 | #316 | Tragic 61.9% |