Immigrants from Venezuela vs Immigrants from Ireland Family Households
COMPARE
Immigrants from Venezuela
Immigrants from Ireland
Family Households
Family Households Comparison
Immigrants from Venezuela
Immigrants from Ireland
66.4%
FAMILY HOUSEHOLDS
100.0/ 100
METRIC RATING
48th/ 347
METRIC RANK
63.2%
FAMILY HOUSEHOLDS
0.6/ 100
METRIC RATING
262nd/ 347
METRIC RANK
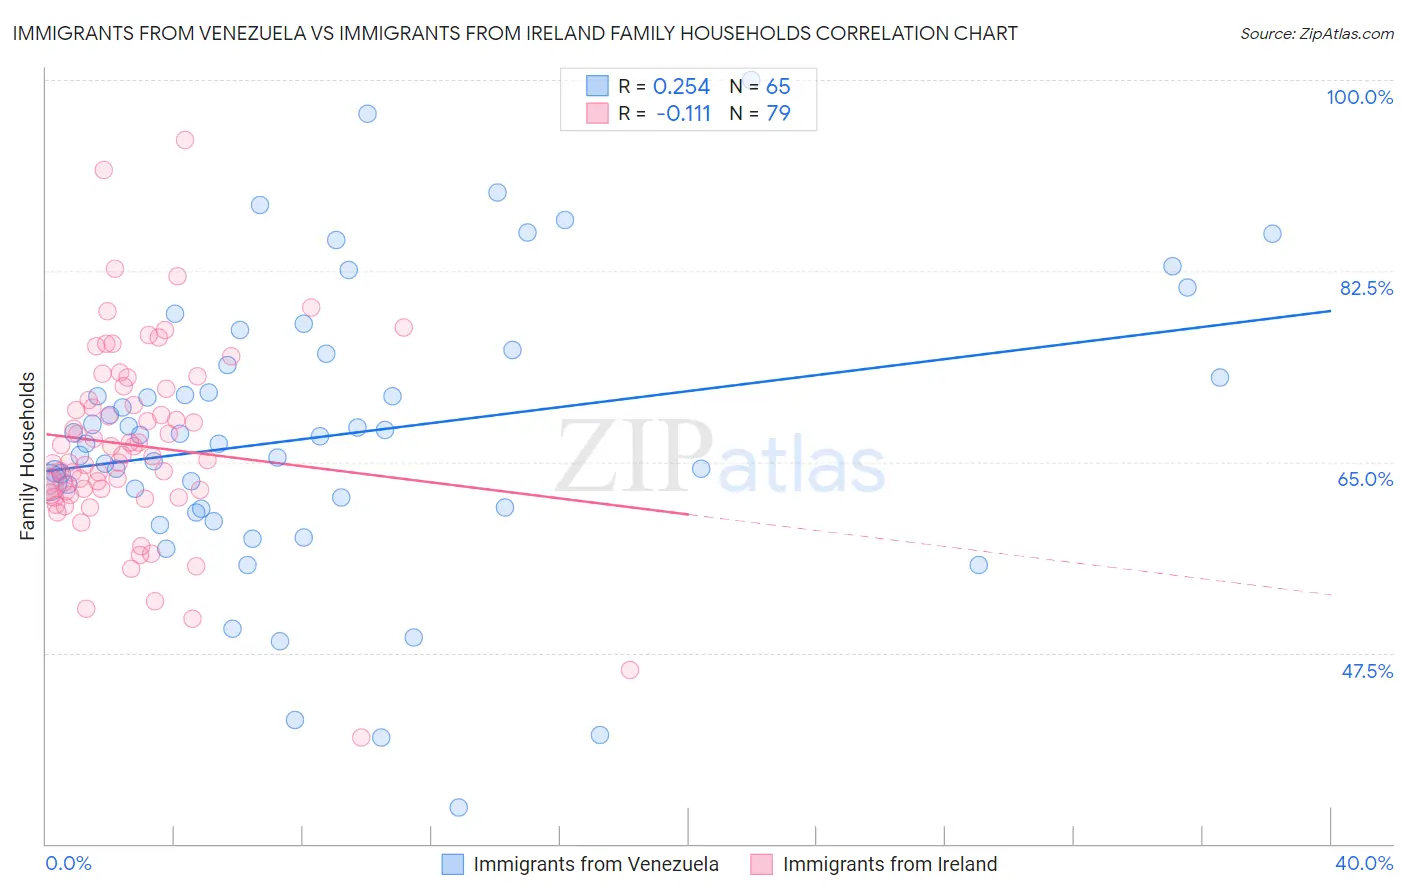
Immigrants from Venezuela vs Immigrants from Ireland Family Households Correlation Chart
The statistical analysis conducted on geographies consisting of 287,786,549 people shows a weak positive correlation between the proportion of Immigrants from Venezuela and percentage of family households in the United States with a correlation coefficient (R) of 0.254 and weighted average of 66.4%. Similarly, the statistical analysis conducted on geographies consisting of 240,750,325 people shows a poor negative correlation between the proportion of Immigrants from Ireland and percentage of family households in the United States with a correlation coefficient (R) of -0.111 and weighted average of 63.2%, a difference of 5.2%.
Family Households Correlation Summary
| Measurement | Immigrants from Venezuela | Immigrants from Ireland |
| Minimum | 33.3% | 39.8% |
| Maximum | 100.0% | 94.4% |
| Range | 66.7% | 54.7% |
| Mean | 67.5% | 66.5% |
| Median | 67.4% | 65.5% |
| Interquartile 25% (IQ1) | 60.7% | 62.1% |
| Interquartile 75% (IQ3) | 74.4% | 71.7% |
| Interquartile Range (IQR) | 13.6% | 9.7% |
| Standard Deviation (Sample) | 13.1% | 8.8% |
| Standard Deviation (Population) | 13.0% | 8.8% |
Similar Demographics by Family Households
Demographics Similar to Immigrants from Venezuela by Family Households
In terms of family households, the demographic groups most similar to Immigrants from Venezuela are Bolivian (66.5%, a difference of 0.020%), Arapaho (66.5%, a difference of 0.050%), Immigrants from South Central Asia (66.4%, a difference of 0.050%), Venezuelan (66.5%, a difference of 0.070%), and Asian (66.5%, a difference of 0.090%).
| Demographics | Rating | Rank | Family Households |
| Immigrants | Bolivia | 100.0 /100 | #41 | Exceptional 66.6% |
| Menominee | 100.0 /100 | #42 | Exceptional 66.5% |
| Apache | 100.0 /100 | #43 | Exceptional 66.5% |
| Asians | 100.0 /100 | #44 | Exceptional 66.5% |
| Venezuelans | 100.0 /100 | #45 | Exceptional 66.5% |
| Arapaho | 100.0 /100 | #46 | Exceptional 66.5% |
| Bolivians | 100.0 /100 | #47 | Exceptional 66.5% |
| Immigrants | Venezuela | 100.0 /100 | #48 | Exceptional 66.4% |
| Immigrants | South Central Asia | 100.0 /100 | #49 | Exceptional 66.4% |
| Navajo | 100.0 /100 | #50 | Exceptional 66.4% |
| Natives/Alaskans | 100.0 /100 | #51 | Exceptional 66.4% |
| Colombians | 100.0 /100 | #52 | Exceptional 66.3% |
| Afghans | 100.0 /100 | #53 | Exceptional 66.3% |
| Immigrants | Colombia | 100.0 /100 | #54 | Exceptional 66.3% |
| Immigrants | Immigrants | 100.0 /100 | #55 | Exceptional 66.1% |
Demographics Similar to Immigrants from Ireland by Family Households
In terms of family households, the demographic groups most similar to Immigrants from Ireland are Immigrants from Russia (63.2%, a difference of 0.010%), Cheyenne (63.2%, a difference of 0.020%), Cypriot (63.2%, a difference of 0.030%), Kenyan (63.2%, a difference of 0.030%), and Colville (63.2%, a difference of 0.040%).
| Demographics | Rating | Rank | Family Households |
| Potawatomi | 1.0 /100 | #255 | Tragic 63.3% |
| Luxembourgers | 0.9 /100 | #256 | Tragic 63.3% |
| Icelanders | 0.8 /100 | #257 | Tragic 63.3% |
| Immigrants | Barbados | 0.7 /100 | #258 | Tragic 63.2% |
| Immigrants | Western Europe | 0.6 /100 | #259 | Tragic 63.2% |
| Cypriots | 0.6 /100 | #260 | Tragic 63.2% |
| Immigrants | Russia | 0.6 /100 | #261 | Tragic 63.2% |
| Immigrants | Ireland | 0.6 /100 | #262 | Tragic 63.2% |
| Cheyenne | 0.5 /100 | #263 | Tragic 63.2% |
| Kenyans | 0.5 /100 | #264 | Tragic 63.2% |
| Colville | 0.5 /100 | #265 | Tragic 63.2% |
| Immigrants | Western Africa | 0.5 /100 | #266 | Tragic 63.1% |
| Israelis | 0.4 /100 | #267 | Tragic 63.1% |
| Immigrants | Singapore | 0.4 /100 | #268 | Tragic 63.1% |
| Yugoslavians | 0.4 /100 | #269 | Tragic 63.1% |