Immigrants from Netherlands vs Immigrants from Hungary Family Households
COMPARE
Immigrants from Netherlands
Immigrants from Hungary
Family Households
Family Households Comparison
Immigrants from Netherlands
Immigrants from Hungary
63.8%
FAMILY HOUSEHOLDS
9.4/ 100
METRIC RATING
212th/ 347
METRIC RANK
63.6%
FAMILY HOUSEHOLDS
4.3/ 100
METRIC RATING
225th/ 347
METRIC RANK
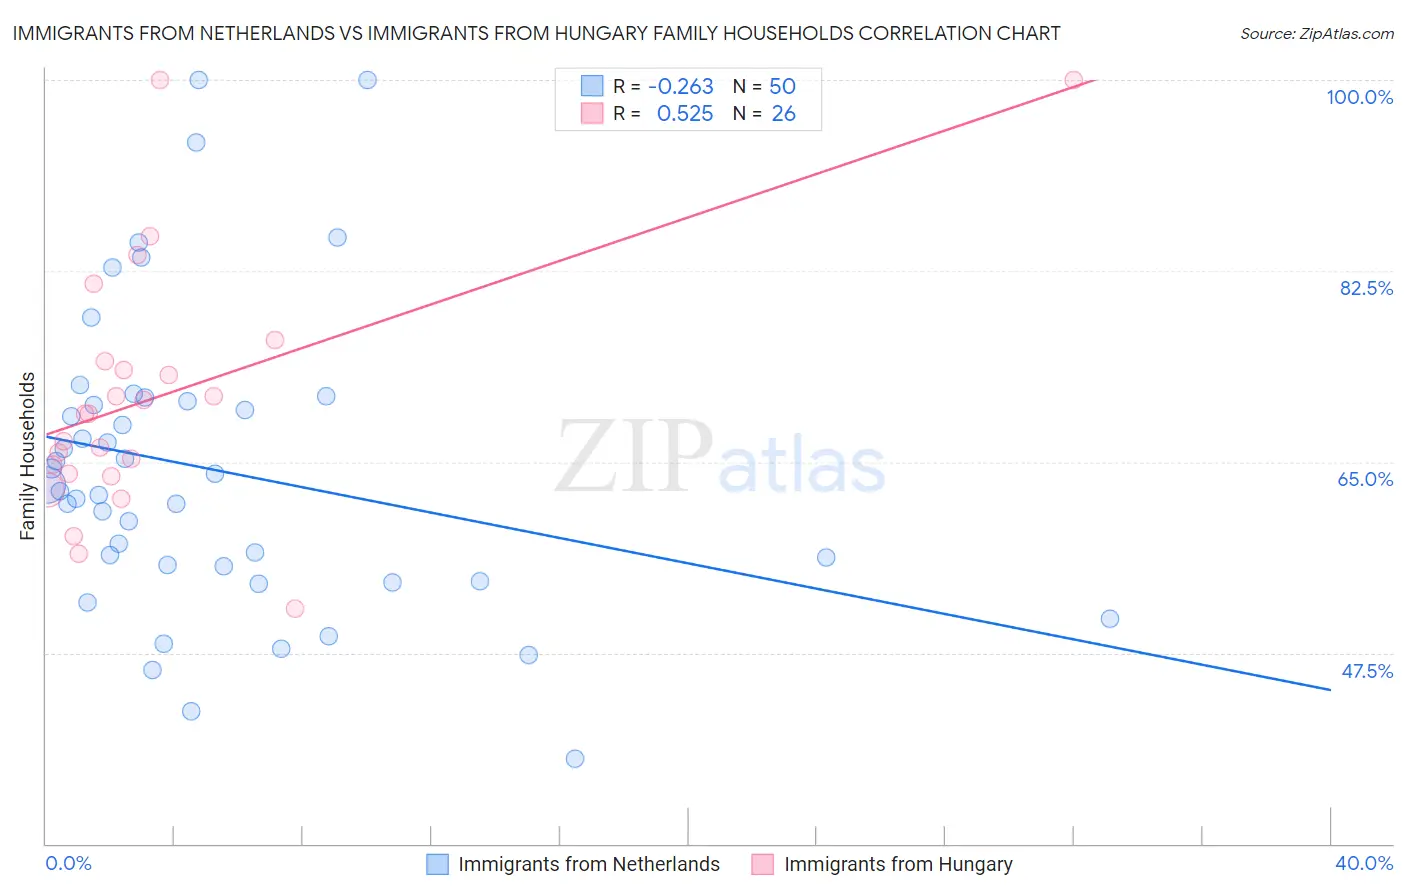
Immigrants from Netherlands vs Immigrants from Hungary Family Households Correlation Chart
The statistical analysis conducted on geographies consisting of 237,802,006 people shows a weak negative correlation between the proportion of Immigrants from Netherlands and percentage of family households in the United States with a correlation coefficient (R) of -0.263 and weighted average of 63.8%. Similarly, the statistical analysis conducted on geographies consisting of 195,664,672 people shows a substantial positive correlation between the proportion of Immigrants from Hungary and percentage of family households in the United States with a correlation coefficient (R) of 0.525 and weighted average of 63.6%, a difference of 0.28%.
Family Households Correlation Summary
| Measurement | Immigrants from Netherlands | Immigrants from Hungary |
| Minimum | 37.8% | 51.6% |
| Maximum | 100.0% | 100.0% |
| Range | 62.2% | 48.4% |
| Mean | 64.3% | 71.0% |
| Median | 62.6% | 69.4% |
| Interquartile 25% (IQ1) | 55.5% | 63.9% |
| Interquartile 75% (IQ3) | 70.6% | 74.2% |
| Interquartile Range (IQR) | 15.1% | 10.3% |
| Standard Deviation (Sample) | 13.8% | 11.6% |
| Standard Deviation (Population) | 13.6% | 11.4% |
Demographics Similar to Immigrants from Netherlands and Immigrants from Hungary by Family Households
In terms of family households, the demographic groups most similar to Immigrants from Netherlands are Shoshone (63.8%, a difference of 0.0%), Immigrants from Thailand (63.8%, a difference of 0.010%), Immigrants from Northern Europe (63.8%, a difference of 0.020%), Celtic (63.8%, a difference of 0.060%), and Immigrants from Bangladesh (63.9%, a difference of 0.070%). Similarly, the demographic groups most similar to Immigrants from Hungary are Turkish (63.6%, a difference of 0.010%), Immigrants from Bahamas (63.6%, a difference of 0.010%), Trinidadian and Tobagonian (63.6%, a difference of 0.020%), Blackfeet (63.6%, a difference of 0.070%), and French Canadian (63.7%, a difference of 0.080%).
| Demographics | Rating | Rank | Family Households |
| Immigrants | Bangladesh | 11.4 /100 | #208 | Poor 63.9% |
| Sierra Leoneans | 11.2 /100 | #209 | Poor 63.9% |
| Immigrants | Thailand | 9.6 /100 | #210 | Tragic 63.8% |
| Shoshone | 9.4 /100 | #211 | Tragic 63.8% |
| Immigrants | Netherlands | 9.4 /100 | #212 | Tragic 63.8% |
| Immigrants | Northern Europe | 8.8 /100 | #213 | Tragic 63.8% |
| Celtics | 8.0 /100 | #214 | Tragic 63.8% |
| Belgians | 7.6 /100 | #215 | Tragic 63.8% |
| Croatians | 7.3 /100 | #216 | Tragic 63.8% |
| Osage | 7.0 /100 | #217 | Tragic 63.7% |
| Marshallese | 6.9 /100 | #218 | Tragic 63.7% |
| Macedonians | 6.5 /100 | #219 | Tragic 63.7% |
| Immigrants | Europe | 6.4 /100 | #220 | Tragic 63.7% |
| Immigrants | South Africa | 5.9 /100 | #221 | Tragic 63.7% |
| Immigrants | Belarus | 5.5 /100 | #222 | Tragic 63.7% |
| French Canadians | 5.4 /100 | #223 | Tragic 63.7% |
| Turks | 4.5 /100 | #224 | Tragic 63.6% |
| Immigrants | Hungary | 4.3 /100 | #225 | Tragic 63.6% |
| Immigrants | Bahamas | 4.2 /100 | #226 | Tragic 63.6% |
| Trinidadians and Tobagonians | 4.1 /100 | #227 | Tragic 63.6% |
| Blackfeet | 3.6 /100 | #228 | Tragic 63.6% |