Alaskan Athabascan vs Immigrants from Hungary 5th Grade
COMPARE
Alaskan Athabascan
Immigrants from Hungary
5th Grade
5th Grade Comparison
Alaskan Athabascans
Immigrants from Hungary
98.3%
5TH GRADE
100.0/ 100
METRIC RATING
11th/ 347
METRIC RANK
97.6%
5TH GRADE
90.1/ 100
METRIC RATING
134th/ 347
METRIC RANK
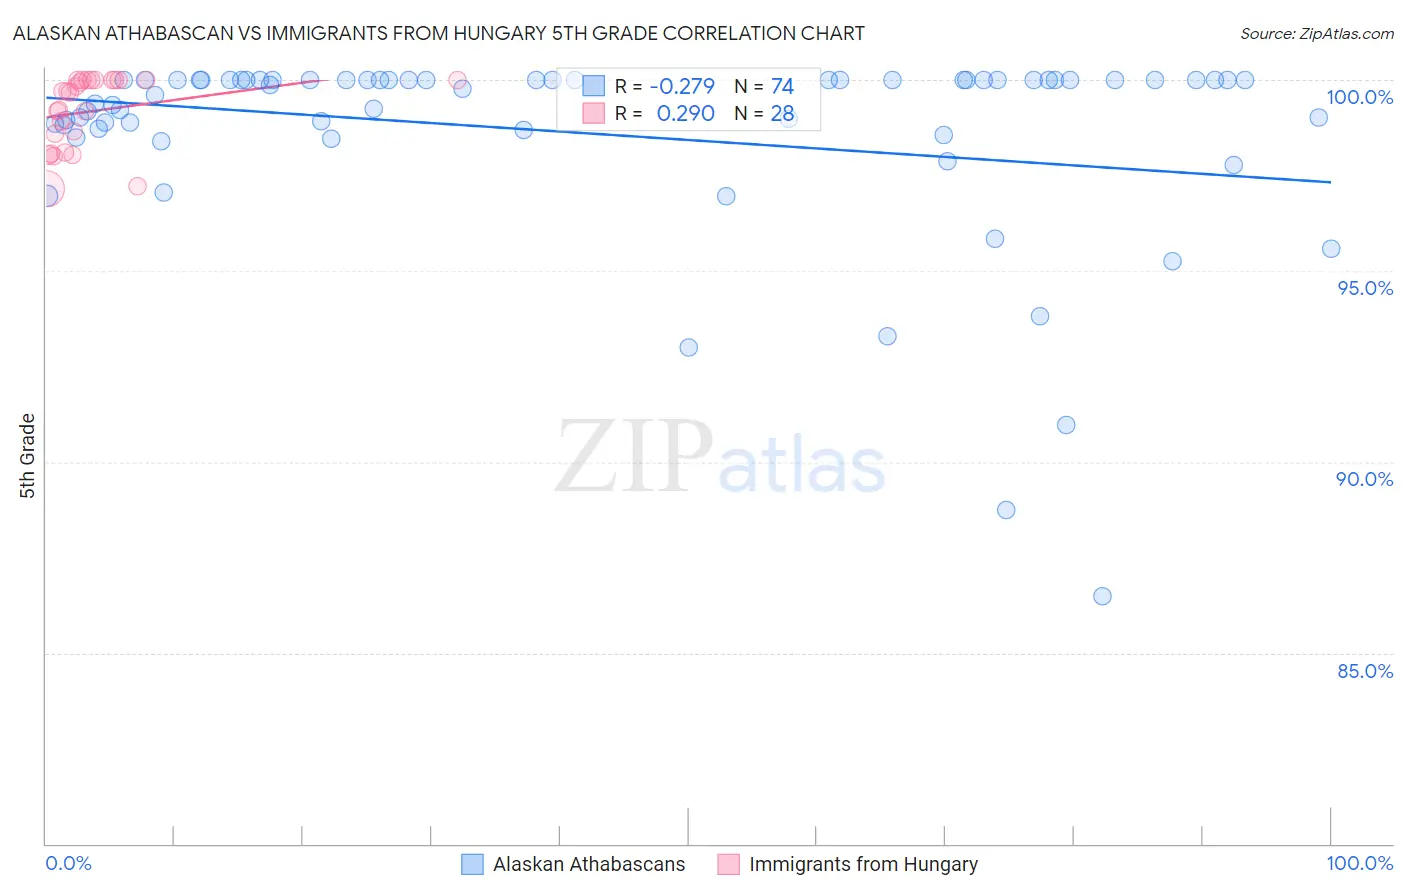
Alaskan Athabascan vs Immigrants from Hungary 5th Grade Correlation Chart
The statistical analysis conducted on geographies consisting of 45,820,365 people shows a weak negative correlation between the proportion of Alaskan Athabascans and percentage of population with at least 5th grade education in the United States with a correlation coefficient (R) of -0.279 and weighted average of 98.3%. Similarly, the statistical analysis conducted on geographies consisting of 195,707,305 people shows a weak positive correlation between the proportion of Immigrants from Hungary and percentage of population with at least 5th grade education in the United States with a correlation coefficient (R) of 0.290 and weighted average of 97.6%, a difference of 0.77%.
5th Grade Correlation Summary
| Measurement | Alaskan Athabascan | Immigrants from Hungary |
| Minimum | 86.5% | 97.1% |
| Maximum | 100.0% | 100.0% |
| Range | 13.5% | 2.9% |
| Mean | 98.6% | 99.2% |
| Median | 99.9% | 99.7% |
| Interquartile 25% (IQ1) | 98.7% | 98.4% |
| Interquartile 75% (IQ3) | 100.0% | 100.0% |
| Interquartile Range (IQR) | 1.3% | 1.6% |
| Standard Deviation (Sample) | 2.6% | 0.93% |
| Standard Deviation (Population) | 2.6% | 0.92% |
Similar Demographics by 5th Grade
Demographics Similar to Alaskan Athabascans by 5th Grade
In terms of 5th grade, the demographic groups most similar to Alaskan Athabascans are Swedish (98.3%, a difference of 0.0%), English (98.3%, a difference of 0.0%), Carpatho Rusyn (98.3%, a difference of 0.010%), Tlingit-Haida (98.3%, a difference of 0.020%), and Dutch (98.3%, a difference of 0.030%).
| Demographics | Rating | Rank | 5th Grade |
| Tsimshian | 100.0 /100 | #4 | Exceptional 98.4% |
| Slovaks | 100.0 /100 | #5 | Exceptional 98.4% |
| Germans | 100.0 /100 | #6 | Exceptional 98.4% |
| Inupiat | 100.0 /100 | #7 | Exceptional 98.4% |
| Slovenes | 100.0 /100 | #8 | Exceptional 98.3% |
| Swedes | 100.0 /100 | #9 | Exceptional 98.3% |
| English | 100.0 /100 | #10 | Exceptional 98.3% |
| Alaskan Athabascans | 100.0 /100 | #11 | Exceptional 98.3% |
| Carpatho Rusyns | 100.0 /100 | #12 | Exceptional 98.3% |
| Tlingit-Haida | 100.0 /100 | #13 | Exceptional 98.3% |
| Dutch | 100.0 /100 | #14 | Exceptional 98.3% |
| Scottish | 100.0 /100 | #15 | Exceptional 98.3% |
| Poles | 100.0 /100 | #16 | Exceptional 98.3% |
| Irish | 100.0 /100 | #17 | Exceptional 98.3% |
| Pennsylvania Germans | 100.0 /100 | #18 | Exceptional 98.3% |
Demographics Similar to Immigrants from Hungary by 5th Grade
In terms of 5th grade, the demographic groups most similar to Immigrants from Hungary are Immigrants from Kuwait (97.6%, a difference of 0.0%), Cambodian (97.6%, a difference of 0.0%), Pima (97.6%, a difference of 0.010%), Palestinian (97.5%, a difference of 0.010%), and Colville (97.6%, a difference of 0.020%).
| Demographics | Rating | Rank | 5th Grade |
| Immigrants | Serbia | 92.3 /100 | #127 | Exceptional 97.6% |
| Colville | 92.0 /100 | #128 | Exceptional 97.6% |
| Immigrants | Europe | 91.9 /100 | #129 | Exceptional 97.6% |
| Immigrants | Romania | 91.6 /100 | #130 | Exceptional 97.6% |
| Pima | 91.2 /100 | #131 | Exceptional 97.6% |
| Immigrants | Kuwait | 90.4 /100 | #132 | Exceptional 97.6% |
| Cambodians | 90.2 /100 | #133 | Exceptional 97.6% |
| Immigrants | Hungary | 90.1 /100 | #134 | Exceptional 97.6% |
| Palestinians | 89.3 /100 | #135 | Excellent 97.5% |
| Immigrants | Moldova | 87.5 /100 | #136 | Excellent 97.5% |
| Filipinos | 86.8 /100 | #137 | Excellent 97.5% |
| Blackfeet | 86.8 /100 | #138 | Excellent 97.5% |
| Immigrants | Turkey | 86.7 /100 | #139 | Excellent 97.5% |
| Burmese | 86.1 /100 | #140 | Excellent 97.5% |
| Seminole | 85.8 /100 | #141 | Excellent 97.5% |