Alaskan Athabascan vs Celtic Average Family Size
COMPARE
Alaskan Athabascan
Celtic
Average Family Size
Average Family Size Comparison
Alaskan Athabascans
Celtics
3.27
AVERAGE FAMILY SIZE
92.4/ 100
METRIC RATING
123rd/ 347
METRIC RANK
3.11
AVERAGE FAMILY SIZE
0.0/ 100
METRIC RATING
324th/ 347
METRIC RANK
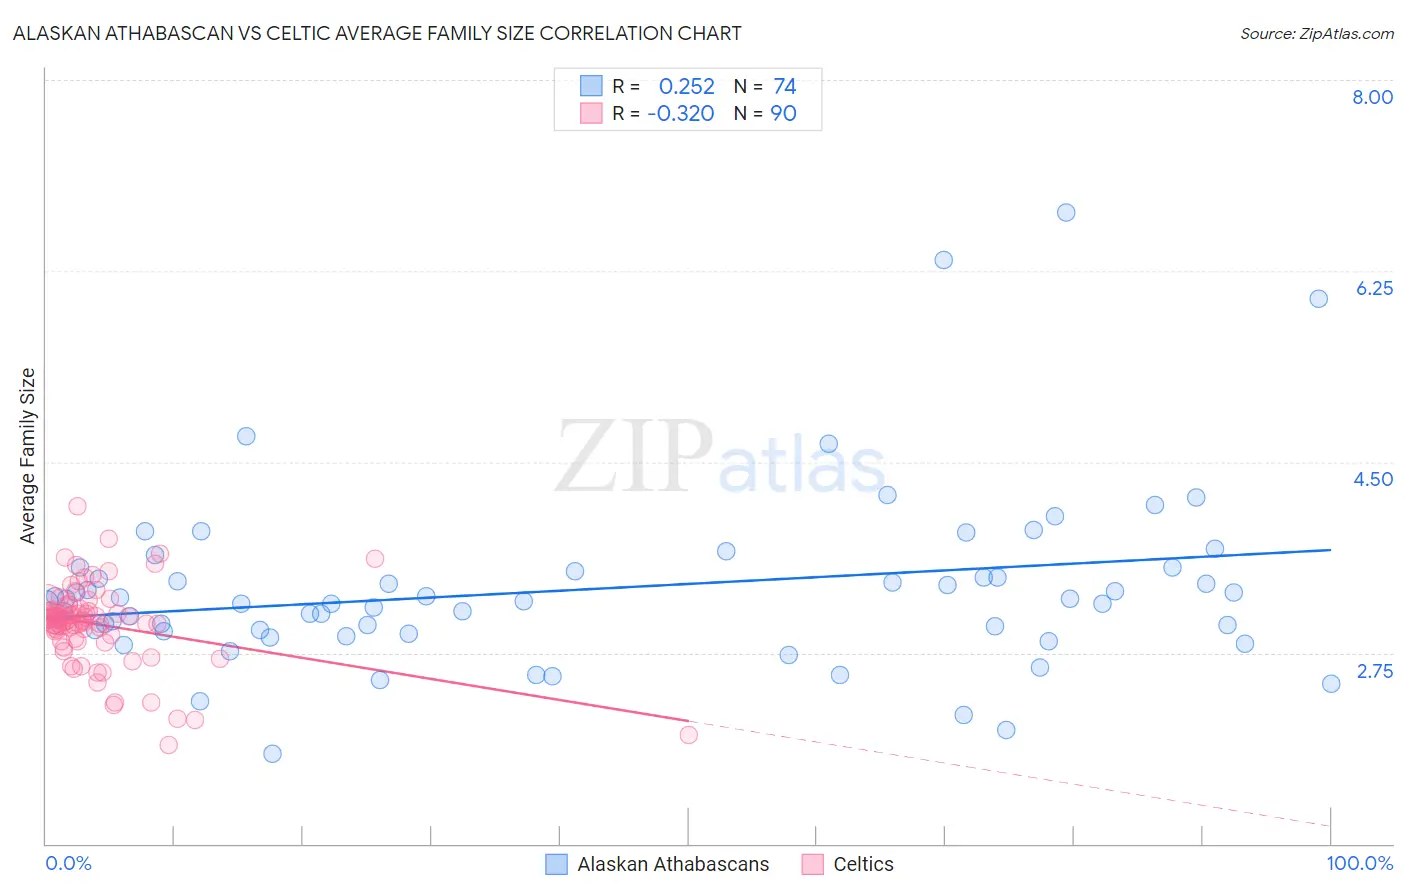
Alaskan Athabascan vs Celtic Average Family Size Correlation Chart
The statistical analysis conducted on geographies consisting of 45,814,644 people shows a weak positive correlation between the proportion of Alaskan Athabascans and average family size in the United States with a correlation coefficient (R) of 0.252 and weighted average of 3.27. Similarly, the statistical analysis conducted on geographies consisting of 168,846,519 people shows a mild negative correlation between the proportion of Celtics and average family size in the United States with a correlation coefficient (R) of -0.320 and weighted average of 3.11, a difference of 4.9%.
Average Family Size Correlation Summary
| Measurement | Alaskan Athabascan | Celtic |
| Minimum | 1.83 | 1.91 |
| Maximum | 6.79 | 4.09 |
| Range | 4.96 | 2.18 |
| Mean | 3.34 | 3.01 |
| Median | 3.21 | 3.05 |
| Interquartile 25% (IQ1) | 2.95 | 2.91 |
| Interquartile 75% (IQ3) | 3.50 | 3.15 |
| Interquartile Range (IQR) | 0.55 | 0.24 |
| Standard Deviation (Sample) | 0.82 | 0.37 |
| Standard Deviation (Population) | 0.82 | 0.37 |
Similar Demographics by Average Family Size
Demographics Similar to Alaskan Athabascans by Average Family Size
In terms of average family size, the demographic groups most similar to Alaskan Athabascans are Immigrants from Colombia (3.27, a difference of 0.020%), South American Indian (3.26, a difference of 0.050%), Immigrants from Thailand (3.27, a difference of 0.060%), Immigrants from Cuba (3.26, a difference of 0.070%), and Immigrants from Bahamas (3.27, a difference of 0.080%).
| Demographics | Rating | Rank | Average Family Size |
| Immigrants | South America | 95.0 /100 | #116 | Exceptional 3.27 |
| Kiowa | 94.8 /100 | #117 | Exceptional 3.27 |
| Immigrants | Asia | 94.0 /100 | #118 | Exceptional 3.27 |
| Immigrants | Indonesia | 93.7 /100 | #119 | Exceptional 3.27 |
| Immigrants | Bahamas | 93.6 /100 | #120 | Exceptional 3.27 |
| Immigrants | Thailand | 93.3 /100 | #121 | Exceptional 3.27 |
| Immigrants | Colombia | 92.8 /100 | #122 | Exceptional 3.27 |
| Alaskan Athabascans | 92.4 /100 | #123 | Exceptional 3.27 |
| South American Indians | 91.6 /100 | #124 | Exceptional 3.26 |
| Immigrants | Cuba | 91.3 /100 | #125 | Exceptional 3.26 |
| Immigrants | Costa Rica | 90.7 /100 | #126 | Exceptional 3.26 |
| Immigrants | Syria | 90.6 /100 | #127 | Exceptional 3.26 |
| Colombians | 89.9 /100 | #128 | Excellent 3.26 |
| Immigrants | Hong Kong | 88.6 /100 | #129 | Excellent 3.26 |
| Laotians | 88.5 /100 | #130 | Excellent 3.26 |
Demographics Similar to Celtics by Average Family Size
In terms of average family size, the demographic groups most similar to Celtics are English (3.11, a difference of 0.040%), Soviet Union (3.11, a difference of 0.080%), Ottawa (3.11, a difference of 0.090%), Dutch (3.11, a difference of 0.10%), and Czech (3.11, a difference of 0.10%).
| Demographics | Rating | Rank | Average Family Size |
| Italians | 0.1 /100 | #317 | Tragic 3.12 |
| Eastern Europeans | 0.1 /100 | #318 | Tragic 3.12 |
| Welsh | 0.1 /100 | #319 | Tragic 3.12 |
| Immigrants | North America | 0.0 /100 | #320 | Tragic 3.12 |
| Immigrants | Austria | 0.0 /100 | #321 | Tragic 3.12 |
| Immigrants | Canada | 0.0 /100 | #322 | Tragic 3.12 |
| Soviet Union | 0.0 /100 | #323 | Tragic 3.11 |
| Celtics | 0.0 /100 | #324 | Tragic 3.11 |
| English | 0.0 /100 | #325 | Tragic 3.11 |
| Ottawa | 0.0 /100 | #326 | Tragic 3.11 |
| Dutch | 0.0 /100 | #327 | Tragic 3.11 |
| Czechs | 0.0 /100 | #328 | Tragic 3.11 |
| Belgians | 0.0 /100 | #329 | Tragic 3.11 |
| Latvians | 0.0 /100 | #330 | Tragic 3.11 |
| Scotch-Irish | 0.0 /100 | #331 | Tragic 3.11 |