Ecuadorian vs Immigrants from Fiji Single Mother Households
COMPARE
Ecuadorian
Immigrants from Fiji
Single Mother Households
Single Mother Households Comparison
Ecuadorians
Immigrants from Fiji
7.2%
SINGLE MOTHER HOUSEHOLDS
0.6/ 100
METRIC RATING
243rd/ 347
METRIC RANK
6.7%
SINGLE MOTHER HOUSEHOLDS
11.9/ 100
METRIC RATING
204th/ 347
METRIC RANK
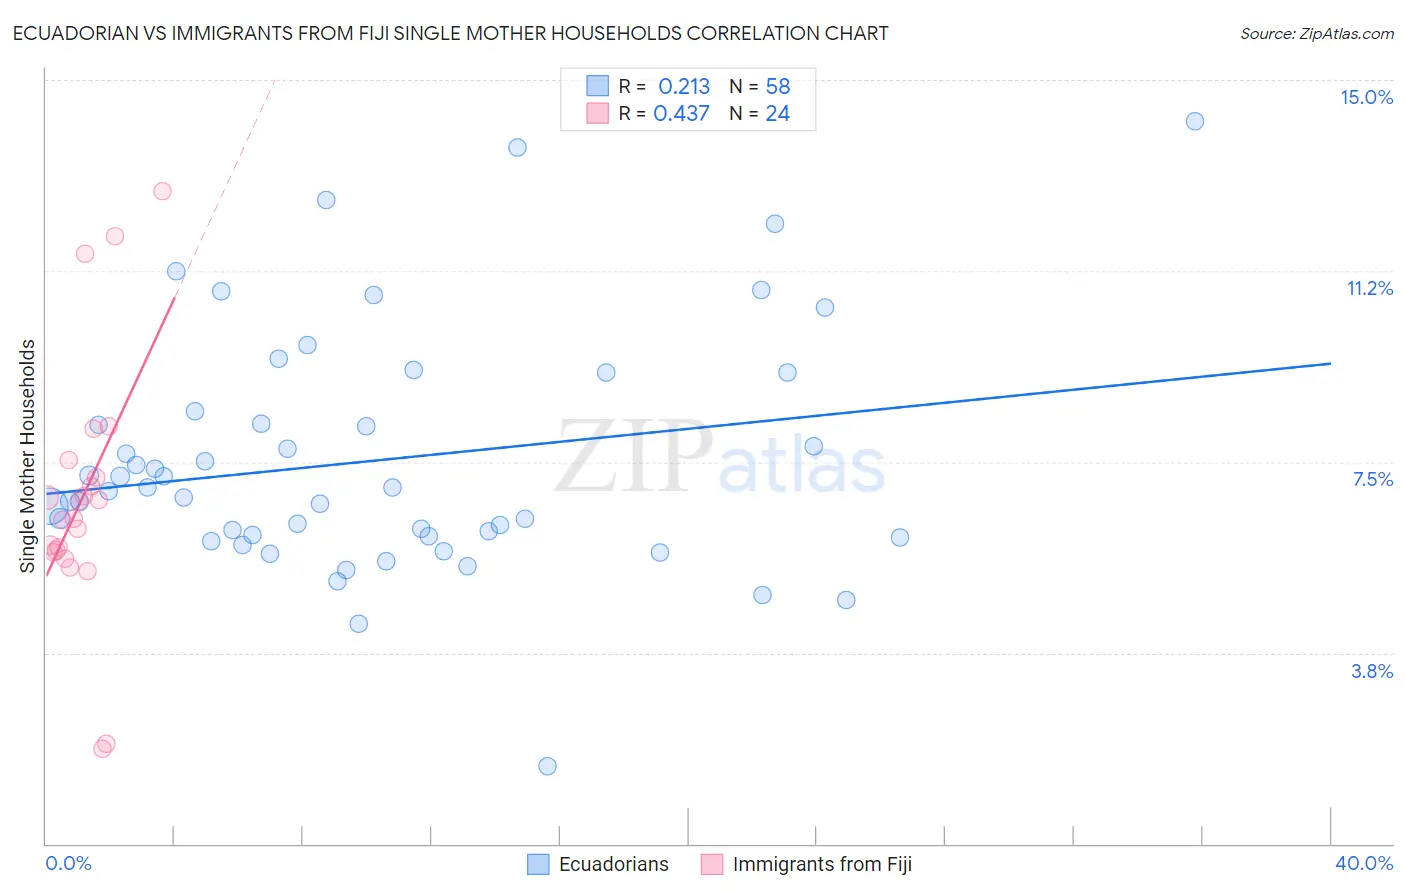
Ecuadorian vs Immigrants from Fiji Single Mother Households Correlation Chart
The statistical analysis conducted on geographies consisting of 317,272,224 people shows a weak positive correlation between the proportion of Ecuadorians and percentage of single mother households in the United States with a correlation coefficient (R) of 0.213 and weighted average of 7.2%. Similarly, the statistical analysis conducted on geographies consisting of 93,728,014 people shows a moderate positive correlation between the proportion of Immigrants from Fiji and percentage of single mother households in the United States with a correlation coefficient (R) of 0.437 and weighted average of 6.7%, a difference of 8.1%.
Single Mother Households Correlation Summary
| Measurement | Ecuadorian | Immigrants from Fiji |
| Minimum | 1.5% | 1.9% |
| Maximum | 14.2% | 12.8% |
| Range | 12.7% | 10.9% |
| Mean | 7.5% | 6.8% |
| Median | 7.0% | 6.6% |
| Interquartile 25% (IQ1) | 6.0% | 5.7% |
| Interquartile 75% (IQ3) | 8.5% | 7.4% |
| Interquartile Range (IQR) | 2.5% | 1.6% |
| Standard Deviation (Sample) | 2.4% | 2.5% |
| Standard Deviation (Population) | 2.4% | 2.5% |
Similar Demographics by Single Mother Households
Demographics Similar to Ecuadorians by Single Mother Households
In terms of single mother households, the demographic groups most similar to Ecuadorians are Fijian (7.2%, a difference of 0.050%), Cuban (7.2%, a difference of 0.070%), Immigrants from Portugal (7.2%, a difference of 0.13%), Immigrants from Cambodia (7.2%, a difference of 0.41%), and Immigrants from Panama (7.2%, a difference of 0.48%).
| Demographics | Rating | Rank | Single Mother Households |
| Ute | 1.0 /100 | #236 | Tragic 7.1% |
| Arapaho | 1.0 /100 | #237 | Tragic 7.1% |
| Panamanians | 0.9 /100 | #238 | Tragic 7.1% |
| Kiowa | 0.8 /100 | #239 | Tragic 7.1% |
| Immigrants | Panama | 0.7 /100 | #240 | Tragic 7.2% |
| Immigrants | Portugal | 0.6 /100 | #241 | Tragic 7.2% |
| Fijians | 0.6 /100 | #242 | Tragic 7.2% |
| Ecuadorians | 0.6 /100 | #243 | Tragic 7.2% |
| Cubans | 0.6 /100 | #244 | Tragic 7.2% |
| Immigrants | Cambodia | 0.5 /100 | #245 | Tragic 7.2% |
| Nicaraguans | 0.5 /100 | #246 | Tragic 7.2% |
| Dutch West Indians | 0.4 /100 | #247 | Tragic 7.3% |
| Spanish American Indians | 0.4 /100 | #248 | Tragic 7.3% |
| Bermudans | 0.4 /100 | #249 | Tragic 7.3% |
| Immigrants | Africa | 0.4 /100 | #250 | Tragic 7.3% |
Demographics Similar to Immigrants from Fiji by Single Mother Households
In terms of single mother households, the demographic groups most similar to Immigrants from Fiji are Immigrants from Peru (6.7%, a difference of 0.010%), Cree (6.7%, a difference of 0.020%), German Russian (6.7%, a difference of 0.10%), Immigrants from South America (6.7%, a difference of 0.10%), and Guamanian/Chamorro (6.6%, a difference of 0.11%).
| Demographics | Rating | Rank | Single Mother Households |
| Moroccans | 17.4 /100 | #197 | Poor 6.6% |
| Hawaiians | 16.1 /100 | #198 | Poor 6.6% |
| Potawatomi | 15.5 /100 | #199 | Poor 6.6% |
| Immigrants | Ethiopia | 14.7 /100 | #200 | Poor 6.6% |
| Venezuelans | 12.9 /100 | #201 | Poor 6.6% |
| Guamanians/Chamorros | 12.4 /100 | #202 | Poor 6.6% |
| Immigrants | Peru | 12.0 /100 | #203 | Poor 6.7% |
| Immigrants | Fiji | 11.9 /100 | #204 | Poor 6.7% |
| Cree | 11.9 /100 | #205 | Poor 6.7% |
| German Russians | 11.5 /100 | #206 | Poor 6.7% |
| Immigrants | South America | 11.5 /100 | #207 | Poor 6.7% |
| Vietnamese | 11.3 /100 | #208 | Poor 6.7% |
| Immigrants | Colombia | 10.5 /100 | #209 | Poor 6.7% |
| Immigrants | Nonimmigrants | 10.4 /100 | #210 | Poor 6.7% |
| Immigrants | Venezuela | 8.5 /100 | #211 | Tragic 6.7% |