Delaware vs Immigrants from Fiji Single Mother Households
COMPARE
Delaware
Immigrants from Fiji
Single Mother Households
Single Mother Households Comparison
Delaware
Immigrants from Fiji
6.5%
SINGLE MOTHER HOUSEHOLDS
23.3/ 100
METRIC RATING
189th/ 347
METRIC RANK
6.7%
SINGLE MOTHER HOUSEHOLDS
11.9/ 100
METRIC RATING
204th/ 347
METRIC RANK
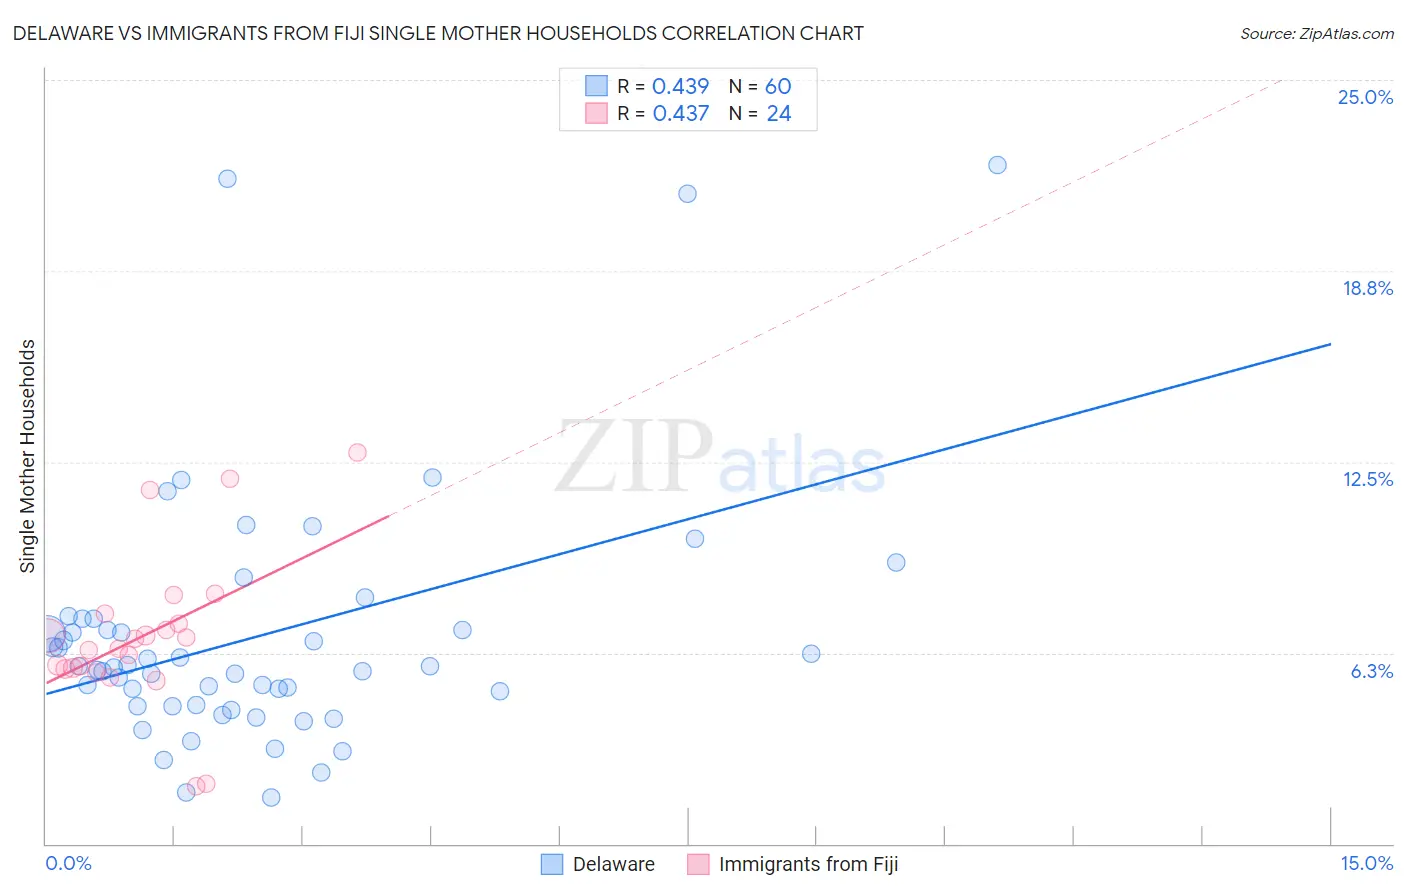
Delaware vs Immigrants from Fiji Single Mother Households Correlation Chart
The statistical analysis conducted on geographies consisting of 96,147,855 people shows a moderate positive correlation between the proportion of Delaware and percentage of single mother households in the United States with a correlation coefficient (R) of 0.439 and weighted average of 6.5%. Similarly, the statistical analysis conducted on geographies consisting of 93,728,014 people shows a moderate positive correlation between the proportion of Immigrants from Fiji and percentage of single mother households in the United States with a correlation coefficient (R) of 0.437 and weighted average of 6.7%, a difference of 2.1%.
Single Mother Households Correlation Summary
| Measurement | Delaware | Immigrants from Fiji |
| Minimum | 1.5% | 1.9% |
| Maximum | 22.2% | 12.8% |
| Range | 20.7% | 10.9% |
| Mean | 6.8% | 6.8% |
| Median | 5.8% | 6.6% |
| Interquartile 25% (IQ1) | 4.5% | 5.7% |
| Interquartile 75% (IQ3) | 7.2% | 7.4% |
| Interquartile Range (IQR) | 2.6% | 1.6% |
| Standard Deviation (Sample) | 4.2% | 2.5% |
| Standard Deviation (Population) | 4.1% | 2.5% |
Demographics Similar to Delaware and Immigrants from Fiji by Single Mother Households
In terms of single mother households, the demographic groups most similar to Delaware are Ottawa (6.5%, a difference of 0.070%), Immigrants from Afghanistan (6.5%, a difference of 0.20%), Costa Rican (6.5%, a difference of 0.21%), Peruvian (6.5%, a difference of 0.26%), and Samoan (6.5%, a difference of 0.32%). Similarly, the demographic groups most similar to Immigrants from Fiji are Immigrants from Peru (6.7%, a difference of 0.010%), Cree (6.7%, a difference of 0.020%), German Russian (6.7%, a difference of 0.10%), Guamanian/Chamorro (6.6%, a difference of 0.11%), and Venezuelan (6.6%, a difference of 0.22%).
| Demographics | Rating | Rank | Single Mother Households |
| Costa Ricans | 24.8 /100 | #186 | Fair 6.5% |
| Immigrants | Afghanistan | 24.7 /100 | #187 | Fair 6.5% |
| Ottawa | 23.8 /100 | #188 | Fair 6.5% |
| Delaware | 23.3 /100 | #189 | Fair 6.5% |
| Peruvians | 21.6 /100 | #190 | Fair 6.5% |
| Samoans | 21.2 /100 | #191 | Fair 6.5% |
| Americans | 19.0 /100 | #192 | Poor 6.6% |
| Colombians | 18.3 /100 | #193 | Poor 6.6% |
| Immigrants | Uganda | 18.3 /100 | #194 | Poor 6.6% |
| South Americans | 18.0 /100 | #195 | Poor 6.6% |
| Uruguayans | 18.0 /100 | #196 | Poor 6.6% |
| Moroccans | 17.4 /100 | #197 | Poor 6.6% |
| Hawaiians | 16.1 /100 | #198 | Poor 6.6% |
| Potawatomi | 15.5 /100 | #199 | Poor 6.6% |
| Immigrants | Ethiopia | 14.7 /100 | #200 | Poor 6.6% |
| Venezuelans | 12.9 /100 | #201 | Poor 6.6% |
| Guamanians/Chamorros | 12.4 /100 | #202 | Poor 6.6% |
| Immigrants | Peru | 12.0 /100 | #203 | Poor 6.7% |
| Immigrants | Fiji | 11.9 /100 | #204 | Poor 6.7% |
| Cree | 11.9 /100 | #205 | Poor 6.7% |
| German Russians | 11.5 /100 | #206 | Poor 6.7% |