Spaniard vs Immigrants from Fiji Single Mother Households
COMPARE
Spaniard
Immigrants from Fiji
Single Mother Households
Single Mother Households Comparison
Spaniards
Immigrants from Fiji
6.5%
SINGLE MOTHER HOUSEHOLDS
27.8/ 100
METRIC RATING
183rd/ 347
METRIC RANK
6.7%
SINGLE MOTHER HOUSEHOLDS
11.9/ 100
METRIC RATING
204th/ 347
METRIC RANK
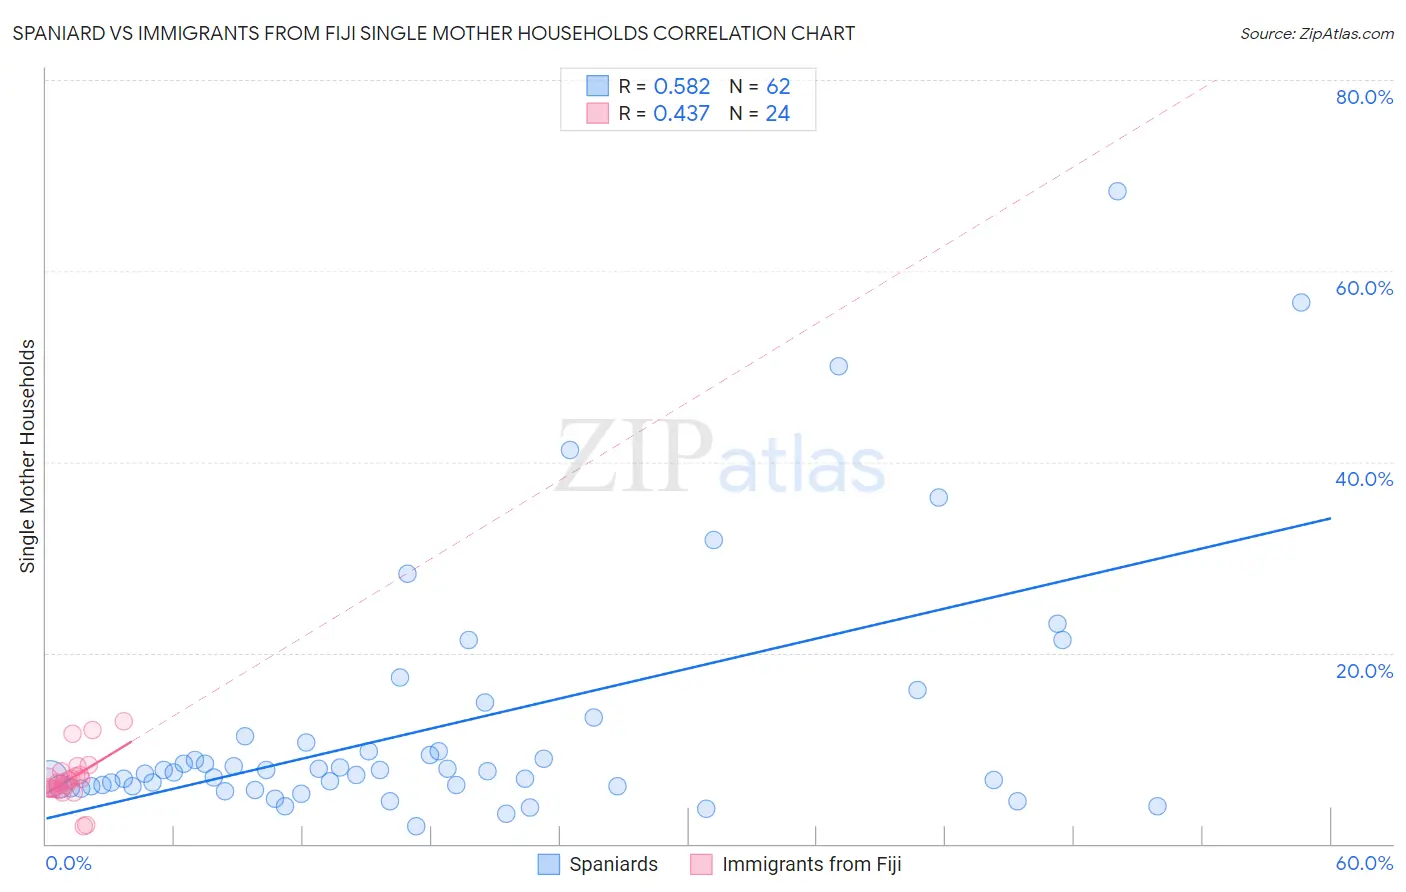
Spaniard vs Immigrants from Fiji Single Mother Households Correlation Chart
The statistical analysis conducted on geographies consisting of 441,881,486 people shows a substantial positive correlation between the proportion of Spaniards and percentage of single mother households in the United States with a correlation coefficient (R) of 0.582 and weighted average of 6.5%. Similarly, the statistical analysis conducted on geographies consisting of 93,728,014 people shows a moderate positive correlation between the proportion of Immigrants from Fiji and percentage of single mother households in the United States with a correlation coefficient (R) of 0.437 and weighted average of 6.7%, a difference of 2.8%.
Single Mother Households Correlation Summary
| Measurement | Spaniard | Immigrants from Fiji |
| Minimum | 1.9% | 1.9% |
| Maximum | 68.3% | 12.8% |
| Range | 66.4% | 10.9% |
| Mean | 12.3% | 6.8% |
| Median | 7.5% | 6.6% |
| Interquartile 25% (IQ1) | 6.0% | 5.7% |
| Interquartile 75% (IQ3) | 10.6% | 7.4% |
| Interquartile Range (IQR) | 4.7% | 1.6% |
| Standard Deviation (Sample) | 13.2% | 2.5% |
| Standard Deviation (Population) | 13.1% | 2.5% |
Similar Demographics by Single Mother Households
Demographics Similar to Spaniards by Single Mother Households
In terms of single mother households, the demographic groups most similar to Spaniards are Ethiopian (6.5%, a difference of 0.24%), Ugandan (6.5%, a difference of 0.30%), Costa Rican (6.5%, a difference of 0.42%), Immigrants from Afghanistan (6.5%, a difference of 0.43%), and Ottawa (6.5%, a difference of 0.56%).
| Demographics | Rating | Rank | Single Mother Households |
| Immigrants | Bosnia and Herzegovina | 44.3 /100 | #176 | Average 6.3% |
| Osage | 43.0 /100 | #177 | Average 6.4% |
| Portuguese | 40.0 /100 | #178 | Fair 6.4% |
| Hmong | 39.8 /100 | #179 | Fair 6.4% |
| Immigrants | Nepal | 36.1 /100 | #180 | Fair 6.4% |
| Spanish | 33.4 /100 | #181 | Fair 6.4% |
| South American Indians | 33.4 /100 | #182 | Fair 6.4% |
| Spaniards | 27.8 /100 | #183 | Fair 6.5% |
| Ethiopians | 26.0 /100 | #184 | Fair 6.5% |
| Ugandans | 25.6 /100 | #185 | Fair 6.5% |
| Costa Ricans | 24.8 /100 | #186 | Fair 6.5% |
| Immigrants | Afghanistan | 24.7 /100 | #187 | Fair 6.5% |
| Ottawa | 23.8 /100 | #188 | Fair 6.5% |
| Delaware | 23.3 /100 | #189 | Fair 6.5% |
| Peruvians | 21.6 /100 | #190 | Fair 6.5% |
Demographics Similar to Immigrants from Fiji by Single Mother Households
In terms of single mother households, the demographic groups most similar to Immigrants from Fiji are Immigrants from Peru (6.7%, a difference of 0.010%), Cree (6.7%, a difference of 0.020%), German Russian (6.7%, a difference of 0.10%), Immigrants from South America (6.7%, a difference of 0.10%), and Guamanian/Chamorro (6.6%, a difference of 0.11%).
| Demographics | Rating | Rank | Single Mother Households |
| Moroccans | 17.4 /100 | #197 | Poor 6.6% |
| Hawaiians | 16.1 /100 | #198 | Poor 6.6% |
| Potawatomi | 15.5 /100 | #199 | Poor 6.6% |
| Immigrants | Ethiopia | 14.7 /100 | #200 | Poor 6.6% |
| Venezuelans | 12.9 /100 | #201 | Poor 6.6% |
| Guamanians/Chamorros | 12.4 /100 | #202 | Poor 6.6% |
| Immigrants | Peru | 12.0 /100 | #203 | Poor 6.7% |
| Immigrants | Fiji | 11.9 /100 | #204 | Poor 6.7% |
| Cree | 11.9 /100 | #205 | Poor 6.7% |
| German Russians | 11.5 /100 | #206 | Poor 6.7% |
| Immigrants | South America | 11.5 /100 | #207 | Poor 6.7% |
| Vietnamese | 11.3 /100 | #208 | Poor 6.7% |
| Immigrants | Colombia | 10.5 /100 | #209 | Poor 6.7% |
| Immigrants | Nonimmigrants | 10.4 /100 | #210 | Poor 6.7% |
| Immigrants | Venezuela | 8.5 /100 | #211 | Tragic 6.7% |