Alaskan Athabascan vs Immigrants from Fiji 10th Grade
COMPARE
Alaskan Athabascan
Immigrants from Fiji
10th Grade
10th Grade Comparison
Alaskan Athabascans
Immigrants from Fiji
95.4%
10TH GRADE
100.0/ 100
METRIC RATING
27th/ 347
METRIC RANK
91.0%
10TH GRADE
0.0/ 100
METRIC RATING
307th/ 347
METRIC RANK
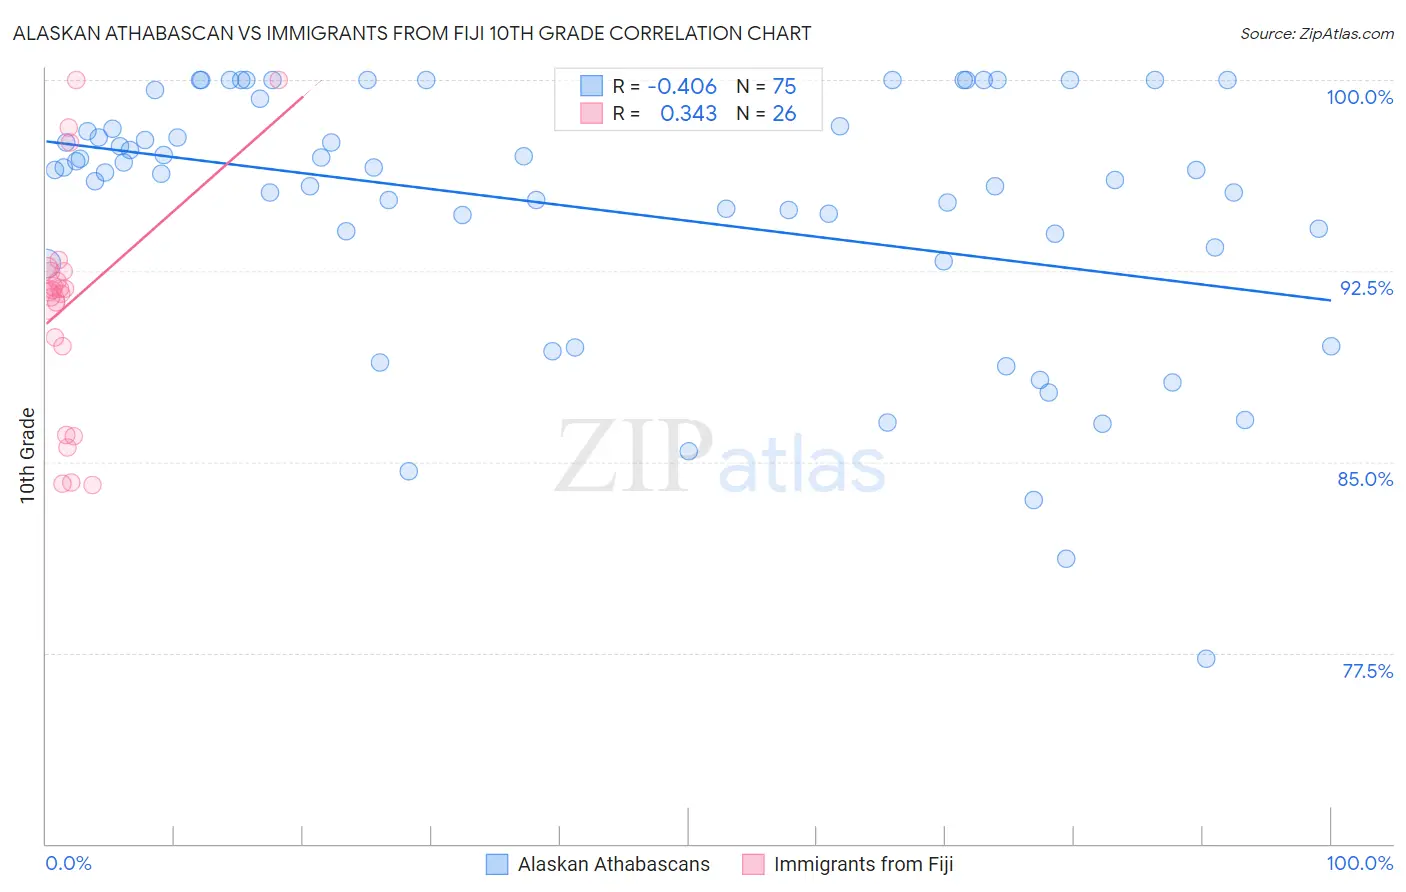
Alaskan Athabascan vs Immigrants from Fiji 10th Grade Correlation Chart
The statistical analysis conducted on geographies consisting of 45,820,444 people shows a moderate negative correlation between the proportion of Alaskan Athabascans and percentage of population with at least 10th grade education in the United States with a correlation coefficient (R) of -0.406 and weighted average of 95.4%. Similarly, the statistical analysis conducted on geographies consisting of 93,756,204 people shows a mild positive correlation between the proportion of Immigrants from Fiji and percentage of population with at least 10th grade education in the United States with a correlation coefficient (R) of 0.343 and weighted average of 91.0%, a difference of 4.8%.
10th Grade Correlation Summary
| Measurement | Alaskan Athabascan | Immigrants from Fiji |
| Minimum | 77.3% | 84.1% |
| Maximum | 100.0% | 100.0% |
| Range | 22.7% | 15.9% |
| Mean | 94.9% | 91.2% |
| Median | 96.4% | 91.7% |
| Interquartile 25% (IQ1) | 93.4% | 89.5% |
| Interquartile 75% (IQ3) | 98.2% | 92.5% |
| Interquartile Range (IQR) | 4.8% | 2.9% |
| Standard Deviation (Sample) | 5.1% | 4.4% |
| Standard Deviation (Population) | 5.1% | 4.4% |
Similar Demographics by 10th Grade
Demographics Similar to Alaskan Athabascans by 10th Grade
In terms of 10th grade, the demographic groups most similar to Alaskan Athabascans are Luxembourger (95.4%, a difference of 0.0%), Welsh (95.5%, a difference of 0.020%), Bulgarian (95.4%, a difference of 0.030%), European (95.5%, a difference of 0.040%), and Maltese (95.5%, a difference of 0.040%).
| Demographics | Rating | Rank | 10th Grade |
| Chinese | 100.0 /100 | #20 | Exceptional 95.5% |
| Dutch | 100.0 /100 | #21 | Exceptional 95.5% |
| Eastern Europeans | 100.0 /100 | #22 | Exceptional 95.5% |
| Czechs | 100.0 /100 | #23 | Exceptional 95.5% |
| Europeans | 100.0 /100 | #24 | Exceptional 95.5% |
| Maltese | 100.0 /100 | #25 | Exceptional 95.5% |
| Welsh | 100.0 /100 | #26 | Exceptional 95.5% |
| Alaskan Athabascans | 100.0 /100 | #27 | Exceptional 95.4% |
| Luxembourgers | 100.0 /100 | #28 | Exceptional 95.4% |
| Bulgarians | 100.0 /100 | #29 | Exceptional 95.4% |
| Belgians | 100.0 /100 | #30 | Exceptional 95.4% |
| Iranians | 100.0 /100 | #31 | Exceptional 95.3% |
| Hungarians | 100.0 /100 | #32 | Exceptional 95.3% |
| French | 100.0 /100 | #33 | Exceptional 95.3% |
| British | 99.9 /100 | #34 | Exceptional 95.3% |
Demographics Similar to Immigrants from Fiji by 10th Grade
In terms of 10th grade, the demographic groups most similar to Immigrants from Fiji are Immigrants from Bangladesh (91.0%, a difference of 0.010%), Immigrants (91.0%, a difference of 0.050%), Yaqui (91.1%, a difference of 0.060%), Vietnamese (90.9%, a difference of 0.090%), and Immigrants from Cambodia (90.9%, a difference of 0.11%).
| Demographics | Rating | Rank | 10th Grade |
| Guyanese | 0.0 /100 | #300 | Tragic 91.4% |
| Japanese | 0.0 /100 | #301 | Tragic 91.2% |
| Immigrants | Guyana | 0.0 /100 | #302 | Tragic 91.2% |
| Immigrants | Vietnam | 0.0 /100 | #303 | Tragic 91.2% |
| Pima | 0.0 /100 | #304 | Tragic 91.2% |
| Immigrants | Dominica | 0.0 /100 | #305 | Tragic 91.1% |
| Yaqui | 0.0 /100 | #306 | Tragic 91.1% |
| Immigrants | Fiji | 0.0 /100 | #307 | Tragic 91.0% |
| Immigrants | Bangladesh | 0.0 /100 | #308 | Tragic 91.0% |
| Immigrants | Immigrants | 0.0 /100 | #309 | Tragic 91.0% |
| Vietnamese | 0.0 /100 | #310 | Tragic 90.9% |
| Immigrants | Cambodia | 0.0 /100 | #311 | Tragic 90.9% |
| Immigrants | Portugal | 0.0 /100 | #312 | Tragic 90.8% |
| Cape Verdeans | 0.0 /100 | #313 | Tragic 90.8% |
| Nepalese | 0.0 /100 | #314 | Tragic 90.7% |