Canadian vs Immigrants from Fiji Single Mother Households
COMPARE
Canadian
Immigrants from Fiji
Single Mother Households
Single Mother Households Comparison
Canadians
Immigrants from Fiji
5.9%
SINGLE MOTHER HOUSEHOLDS
90.5/ 100
METRIC RATING
134th/ 347
METRIC RANK
6.7%
SINGLE MOTHER HOUSEHOLDS
11.9/ 100
METRIC RATING
204th/ 347
METRIC RANK
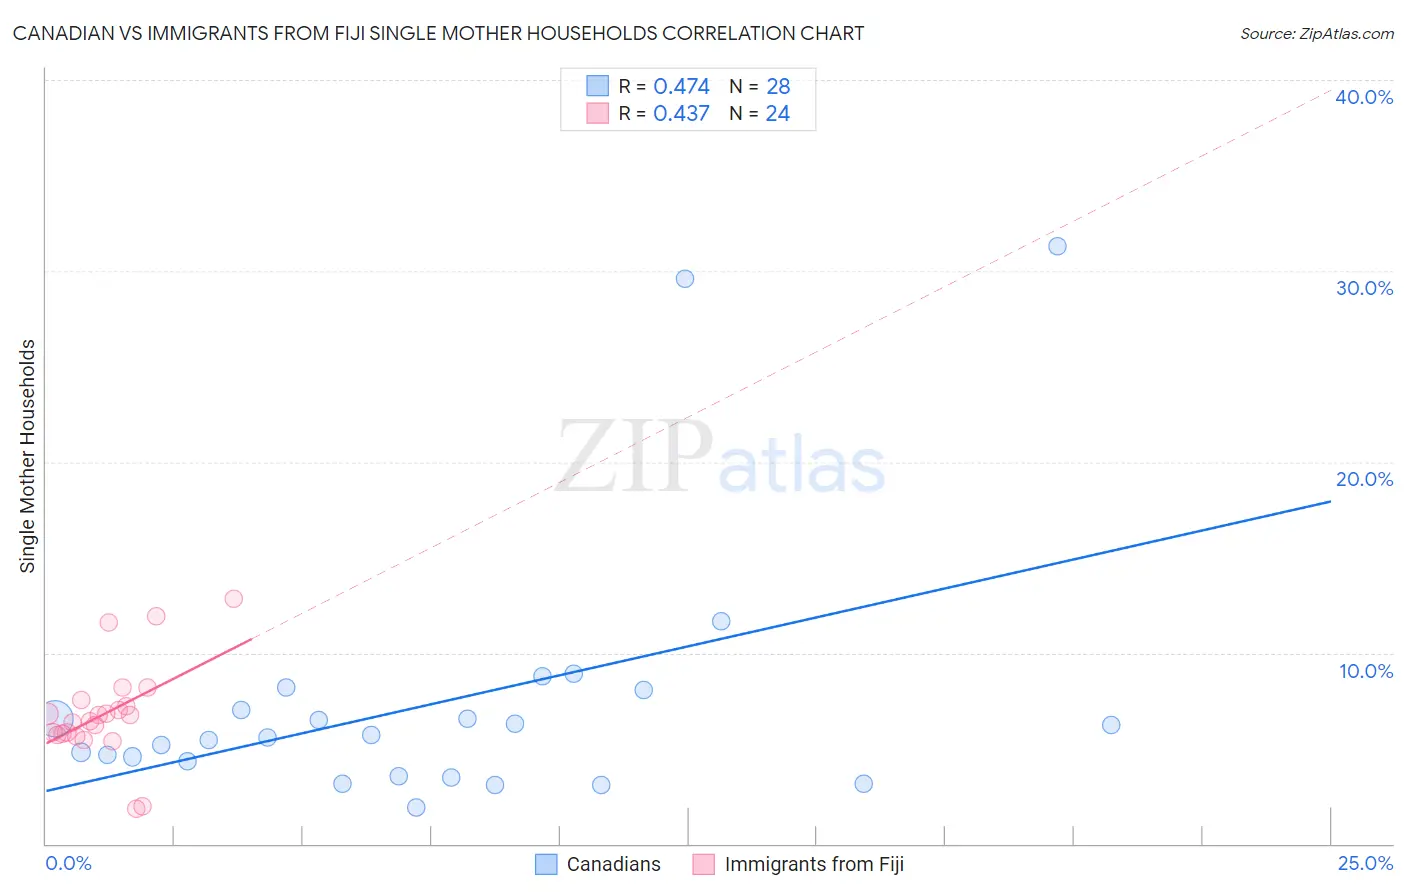
Canadian vs Immigrants from Fiji Single Mother Households Correlation Chart
The statistical analysis conducted on geographies consisting of 435,747,557 people shows a moderate positive correlation between the proportion of Canadians and percentage of single mother households in the United States with a correlation coefficient (R) of 0.474 and weighted average of 5.9%. Similarly, the statistical analysis conducted on geographies consisting of 93,728,014 people shows a moderate positive correlation between the proportion of Immigrants from Fiji and percentage of single mother households in the United States with a correlation coefficient (R) of 0.437 and weighted average of 6.7%, a difference of 12.4%.
Single Mother Households Correlation Summary
| Measurement | Canadian | Immigrants from Fiji |
| Minimum | 1.9% | 1.9% |
| Maximum | 31.3% | 12.8% |
| Range | 29.4% | 10.9% |
| Mean | 7.4% | 6.8% |
| Median | 5.7% | 6.6% |
| Interquartile 25% (IQ1) | 3.9% | 5.7% |
| Interquartile 75% (IQ3) | 7.6% | 7.4% |
| Interquartile Range (IQR) | 3.6% | 1.6% |
| Standard Deviation (Sample) | 6.9% | 2.5% |
| Standard Deviation (Population) | 6.7% | 2.5% |
Similar Demographics by Single Mother Households
Demographics Similar to Canadians by Single Mother Households
In terms of single mother households, the demographic groups most similar to Canadians are Egyptian (5.9%, a difference of 0.060%), Immigrants from Saudi Arabia (5.9%, a difference of 0.090%), Albanian (5.9%, a difference of 0.22%), Immigrants from Spain (5.9%, a difference of 0.26%), and Jordanian (6.0%, a difference of 0.51%).
| Demographics | Rating | Rank | Single Mother Households |
| Lebanese | 92.4 /100 | #127 | Exceptional 5.9% |
| Czechoslovakians | 92.2 /100 | #128 | Exceptional 5.9% |
| Immigrants | Bolivia | 92.2 /100 | #129 | Exceptional 5.9% |
| Palestinians | 92.1 /100 | #130 | Exceptional 5.9% |
| Immigrants | Spain | 91.2 /100 | #131 | Exceptional 5.9% |
| Albanians | 91.1 /100 | #132 | Exceptional 5.9% |
| Egyptians | 90.7 /100 | #133 | Exceptional 5.9% |
| Canadians | 90.5 /100 | #134 | Exceptional 5.9% |
| Immigrants | Saudi Arabia | 90.2 /100 | #135 | Exceptional 5.9% |
| Jordanians | 88.9 /100 | #136 | Excellent 6.0% |
| Immigrants | Pakistan | 88.4 /100 | #137 | Excellent 6.0% |
| Icelanders | 86.9 /100 | #138 | Excellent 6.0% |
| Syrians | 86.0 /100 | #139 | Excellent 6.0% |
| French | 85.7 /100 | #140 | Excellent 6.0% |
| Tsimshian | 85.2 /100 | #141 | Excellent 6.0% |
Demographics Similar to Immigrants from Fiji by Single Mother Households
In terms of single mother households, the demographic groups most similar to Immigrants from Fiji are Immigrants from Peru (6.7%, a difference of 0.010%), Cree (6.7%, a difference of 0.020%), German Russian (6.7%, a difference of 0.10%), Immigrants from South America (6.7%, a difference of 0.10%), and Guamanian/Chamorro (6.6%, a difference of 0.11%).
| Demographics | Rating | Rank | Single Mother Households |
| Moroccans | 17.4 /100 | #197 | Poor 6.6% |
| Hawaiians | 16.1 /100 | #198 | Poor 6.6% |
| Potawatomi | 15.5 /100 | #199 | Poor 6.6% |
| Immigrants | Ethiopia | 14.7 /100 | #200 | Poor 6.6% |
| Venezuelans | 12.9 /100 | #201 | Poor 6.6% |
| Guamanians/Chamorros | 12.4 /100 | #202 | Poor 6.6% |
| Immigrants | Peru | 12.0 /100 | #203 | Poor 6.7% |
| Immigrants | Fiji | 11.9 /100 | #204 | Poor 6.7% |
| Cree | 11.9 /100 | #205 | Poor 6.7% |
| German Russians | 11.5 /100 | #206 | Poor 6.7% |
| Immigrants | South America | 11.5 /100 | #207 | Poor 6.7% |
| Vietnamese | 11.3 /100 | #208 | Poor 6.7% |
| Immigrants | Colombia | 10.5 /100 | #209 | Poor 6.7% |
| Immigrants | Nonimmigrants | 10.4 /100 | #210 | Poor 6.7% |
| Immigrants | Venezuela | 8.5 /100 | #211 | Tragic 6.7% |