Alaska Native vs Houma Family Households
COMPARE
Alaska Native
Houma
Family Households
Family Households Comparison
Alaska Natives
Houma
65.1%
FAMILY HOUSEHOLDS
97.3/ 100
METRIC RATING
107th/ 347
METRIC RANK
65.7%
FAMILY HOUSEHOLDS
99.9/ 100
METRIC RATING
75th/ 347
METRIC RANK
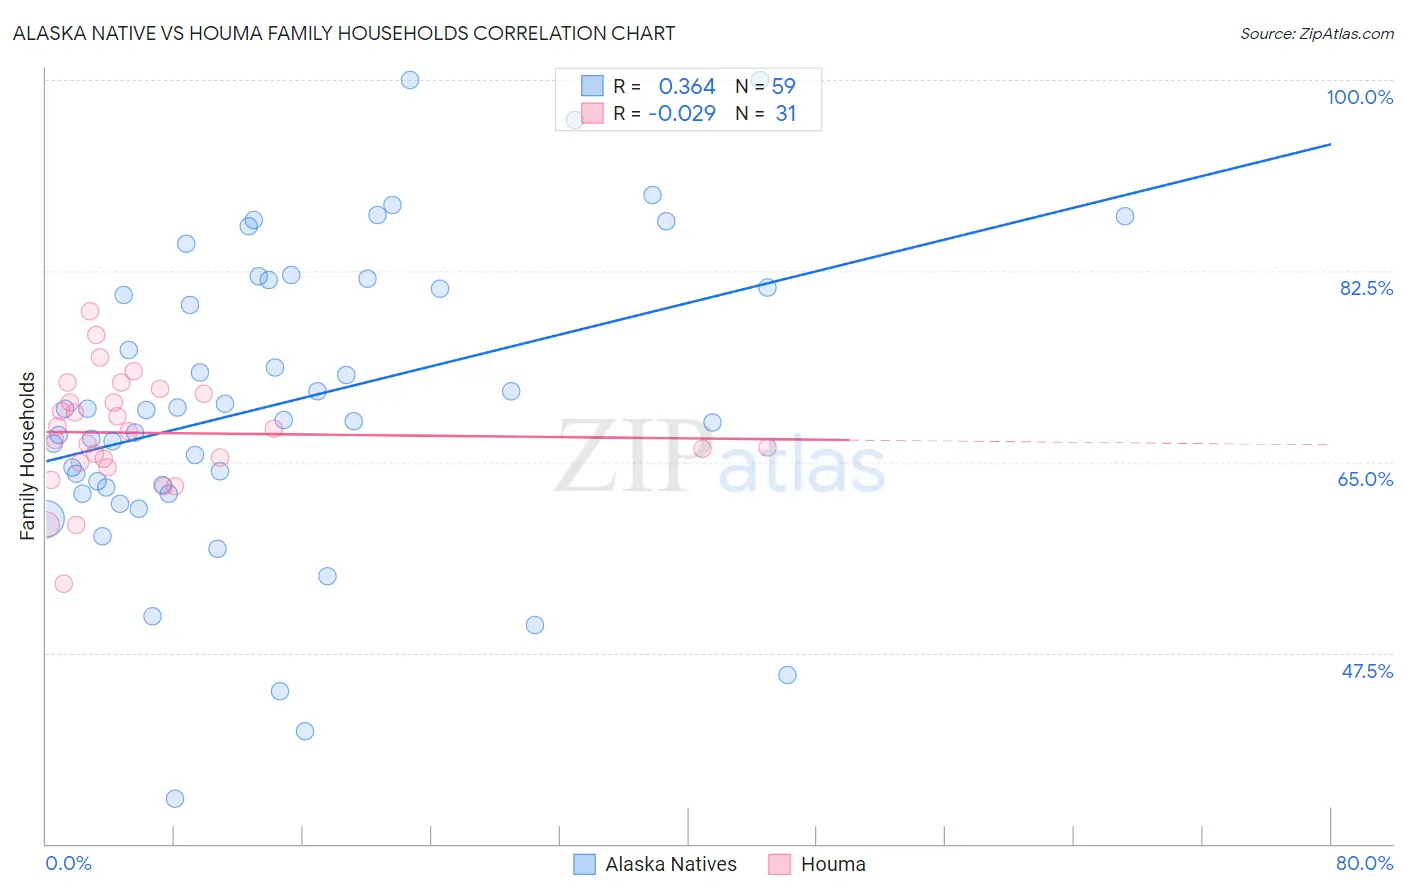
Alaska Native vs Houma Family Households Correlation Chart
The statistical analysis conducted on geographies consisting of 76,756,415 people shows a mild positive correlation between the proportion of Alaska Natives and percentage of family households in the United States with a correlation coefficient (R) of 0.364 and weighted average of 65.1%. Similarly, the statistical analysis conducted on geographies consisting of 36,793,599 people shows no correlation between the proportion of Houma and percentage of family households in the United States with a correlation coefficient (R) of -0.029 and weighted average of 65.7%, a difference of 0.98%.
Family Households Correlation Summary
| Measurement | Alaska Native | Houma |
| Minimum | 34.1% | 53.8% |
| Maximum | 100.0% | 78.8% |
| Range | 65.9% | 25.0% |
| Mean | 70.5% | 67.7% |
| Median | 69.7% | 67.8% |
| Interquartile 25% (IQ1) | 62.6% | 65.0% |
| Interquartile 75% (IQ3) | 81.7% | 71.2% |
| Interquartile Range (IQR) | 19.1% | 6.3% |
| Standard Deviation (Sample) | 14.0% | 5.2% |
| Standard Deviation (Population) | 13.9% | 5.1% |
Similar Demographics by Family Households
Demographics Similar to Alaska Natives by Family Households
In terms of family households, the demographic groups most similar to Alaska Natives are White/Caucasian (65.1%, a difference of 0.0%), English (65.1%, a difference of 0.010%), Palestinian (65.1%, a difference of 0.010%), Immigrants from Guatemala (65.0%, a difference of 0.050%), and Scandinavian (65.0%, a difference of 0.060%).
| Demographics | Rating | Rank | Family Households |
| Haitians | 98.1 /100 | #100 | Exceptional 65.2% |
| Chileans | 98.1 /100 | #101 | Exceptional 65.2% |
| Immigrants | Sri Lanka | 98.0 /100 | #102 | Exceptional 65.1% |
| Indians (Asian) | 97.9 /100 | #103 | Exceptional 65.1% |
| Spaniards | 97.8 /100 | #104 | Exceptional 65.1% |
| English | 97.4 /100 | #105 | Exceptional 65.1% |
| Whites/Caucasians | 97.3 /100 | #106 | Exceptional 65.1% |
| Alaska Natives | 97.3 /100 | #107 | Exceptional 65.1% |
| Palestinians | 97.2 /100 | #108 | Exceptional 65.1% |
| Immigrants | Guatemala | 96.9 /100 | #109 | Exceptional 65.0% |
| Scandinavians | 96.8 /100 | #110 | Exceptional 65.0% |
| Europeans | 96.8 /100 | #111 | Exceptional 65.0% |
| Immigrants | Jordan | 96.5 /100 | #112 | Exceptional 65.0% |
| Spanish | 96.2 /100 | #113 | Exceptional 65.0% |
| Argentineans | 95.7 /100 | #114 | Exceptional 65.0% |
Demographics Similar to Houma by Family Households
In terms of family households, the demographic groups most similar to Houma are Burmese (65.7%, a difference of 0.050%), Laotian (65.8%, a difference of 0.090%), Immigrants from the Azores (65.6%, a difference of 0.12%), Immigrants from South America (65.6%, a difference of 0.12%), and Yaqui (65.6%, a difference of 0.12%).
| Demographics | Rating | Rank | Family Households |
| Japanese | 99.9 /100 | #68 | Exceptional 65.9% |
| Malaysians | 99.9 /100 | #69 | Exceptional 65.9% |
| Immigrants | Afghanistan | 99.9 /100 | #70 | Exceptional 65.9% |
| Bhutanese | 99.9 /100 | #71 | Exceptional 65.9% |
| Portuguese | 99.9 /100 | #72 | Exceptional 65.8% |
| Laotians | 99.9 /100 | #73 | Exceptional 65.8% |
| Burmese | 99.9 /100 | #74 | Exceptional 65.7% |
| Houma | 99.9 /100 | #75 | Exceptional 65.7% |
| Immigrants | Azores | 99.8 /100 | #76 | Exceptional 65.6% |
| Immigrants | South America | 99.8 /100 | #77 | Exceptional 65.6% |
| Yaqui | 99.8 /100 | #78 | Exceptional 65.6% |
| Immigrants | Costa Rica | 99.8 /100 | #79 | Exceptional 65.6% |
| Puget Sound Salish | 99.8 /100 | #80 | Exceptional 65.6% |
| Jordanians | 99.7 /100 | #81 | Exceptional 65.5% |
| Immigrants | Lebanon | 99.7 /100 | #82 | Exceptional 65.5% |