Alaska Native vs Welsh Family Households
COMPARE
Alaska Native
Welsh
Family Households
Family Households Comparison
Alaska Natives
Welsh
65.1%
FAMILY HOUSEHOLDS
97.3/ 100
METRIC RATING
107th/ 347
METRIC RANK
64.6%
FAMILY HOUSEHOLDS
80.1/ 100
METRIC RATING
145th/ 347
METRIC RANK
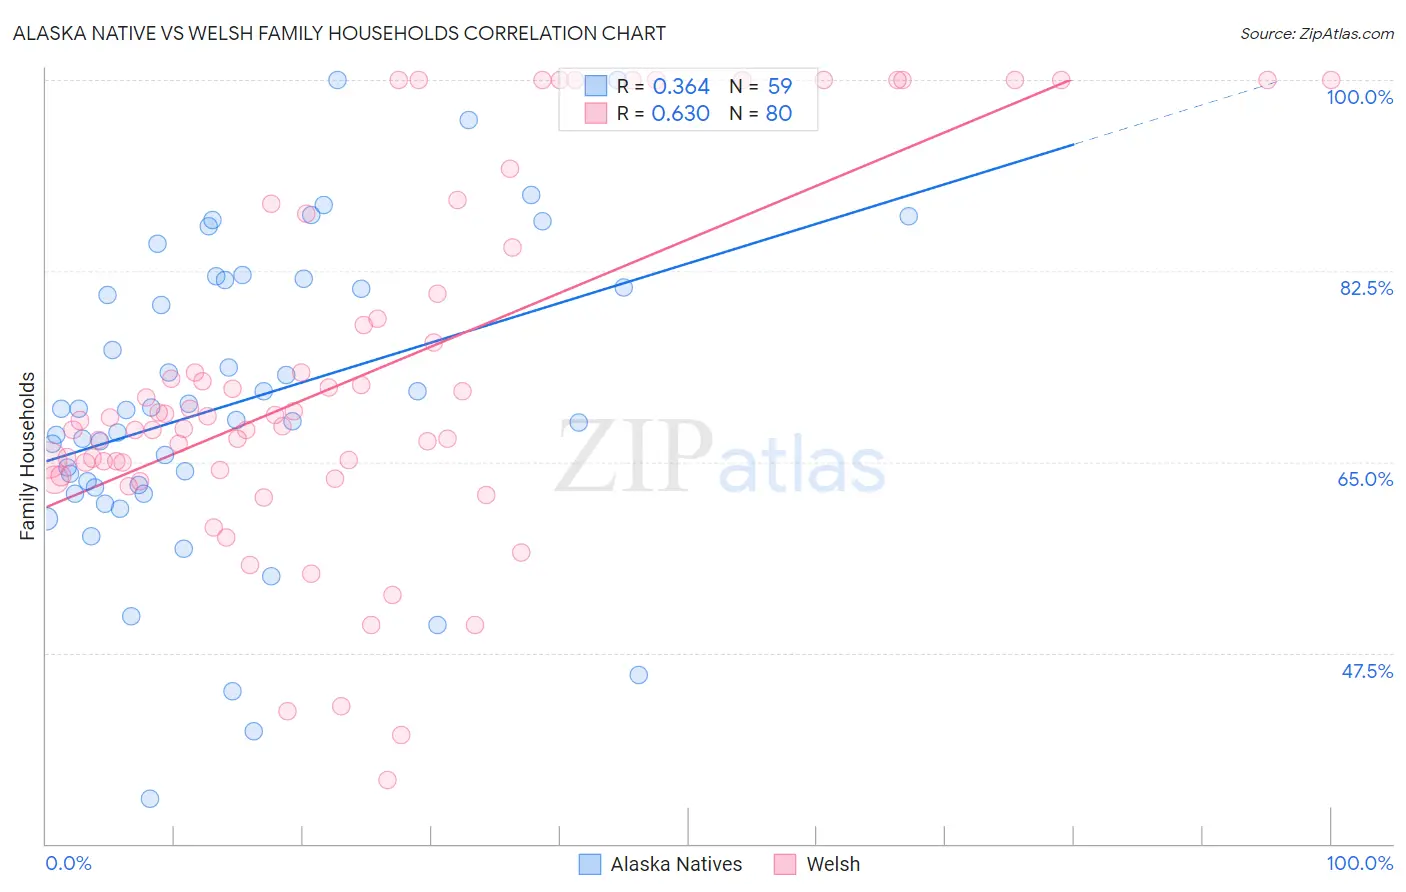
Alaska Native vs Welsh Family Households Correlation Chart
The statistical analysis conducted on geographies consisting of 76,756,415 people shows a mild positive correlation between the proportion of Alaska Natives and percentage of family households in the United States with a correlation coefficient (R) of 0.364 and weighted average of 65.1%. Similarly, the statistical analysis conducted on geographies consisting of 528,179,951 people shows a significant positive correlation between the proportion of Welsh and percentage of family households in the United States with a correlation coefficient (R) of 0.630 and weighted average of 64.6%, a difference of 0.74%.
Family Households Correlation Summary
| Measurement | Alaska Native | Welsh |
| Minimum | 34.1% | 35.9% |
| Maximum | 100.0% | 100.0% |
| Range | 65.9% | 64.1% |
| Mean | 70.5% | 72.8% |
| Median | 69.7% | 68.9% |
| Interquartile 25% (IQ1) | 62.6% | 64.6% |
| Interquartile 75% (IQ3) | 81.7% | 82.5% |
| Interquartile Range (IQR) | 19.1% | 17.9% |
| Standard Deviation (Sample) | 14.0% | 16.3% |
| Standard Deviation (Population) | 13.9% | 16.2% |
Similar Demographics by Family Households
Demographics Similar to Alaska Natives by Family Households
In terms of family households, the demographic groups most similar to Alaska Natives are White/Caucasian (65.1%, a difference of 0.0%), English (65.1%, a difference of 0.010%), Palestinian (65.1%, a difference of 0.010%), Immigrants from Guatemala (65.0%, a difference of 0.050%), and Scandinavian (65.0%, a difference of 0.060%).
| Demographics | Rating | Rank | Family Households |
| Haitians | 98.1 /100 | #100 | Exceptional 65.2% |
| Chileans | 98.1 /100 | #101 | Exceptional 65.2% |
| Immigrants | Sri Lanka | 98.0 /100 | #102 | Exceptional 65.1% |
| Indians (Asian) | 97.9 /100 | #103 | Exceptional 65.1% |
| Spaniards | 97.8 /100 | #104 | Exceptional 65.1% |
| English | 97.4 /100 | #105 | Exceptional 65.1% |
| Whites/Caucasians | 97.3 /100 | #106 | Exceptional 65.1% |
| Alaska Natives | 97.3 /100 | #107 | Exceptional 65.1% |
| Palestinians | 97.2 /100 | #108 | Exceptional 65.1% |
| Immigrants | Guatemala | 96.9 /100 | #109 | Exceptional 65.0% |
| Scandinavians | 96.8 /100 | #110 | Exceptional 65.0% |
| Europeans | 96.8 /100 | #111 | Exceptional 65.0% |
| Immigrants | Jordan | 96.5 /100 | #112 | Exceptional 65.0% |
| Spanish | 96.2 /100 | #113 | Exceptional 65.0% |
| Argentineans | 95.7 /100 | #114 | Exceptional 65.0% |
Demographics Similar to Welsh by Family Households
In terms of family households, the demographic groups most similar to Welsh are Czechoslovakian (64.6%, a difference of 0.040%), South American Indian (64.6%, a difference of 0.040%), Immigrants from Romania (64.6%, a difference of 0.060%), Immigrants from Chile (64.6%, a difference of 0.070%), and Delaware (64.6%, a difference of 0.070%).
| Demographics | Rating | Rank | Family Households |
| Basques | 85.5 /100 | #138 | Excellent 64.7% |
| Immigrants | Jamaica | 85.3 /100 | #139 | Excellent 64.7% |
| Immigrants | North Macedonia | 84.9 /100 | #140 | Excellent 64.7% |
| Immigrants | Cameroon | 84.8 /100 | #141 | Excellent 64.7% |
| Pakistanis | 84.0 /100 | #142 | Excellent 64.7% |
| Czechoslovakians | 82.1 /100 | #143 | Excellent 64.6% |
| South American Indians | 81.9 /100 | #144 | Excellent 64.6% |
| Welsh | 80.1 /100 | #145 | Excellent 64.6% |
| Immigrants | Romania | 77.0 /100 | #146 | Good 64.6% |
| Immigrants | Chile | 76.5 /100 | #147 | Good 64.6% |
| Delaware | 76.3 /100 | #148 | Good 64.6% |
| Sioux | 76.3 /100 | #149 | Good 64.6% |
| Romanians | 75.3 /100 | #150 | Good 64.5% |
| Syrians | 75.2 /100 | #151 | Good 64.5% |
| Scottish | 70.9 /100 | #152 | Good 64.5% |