Alaska Native vs Immigrants from Poland Family Households
COMPARE
Alaska Native
Immigrants from Poland
Family Households
Family Households Comparison
Alaska Natives
Immigrants from Poland
65.1%
FAMILY HOUSEHOLDS
97.3/ 100
METRIC RATING
107th/ 347
METRIC RANK
65.2%
FAMILY HOUSEHOLDS
98.7/ 100
METRIC RATING
94th/ 347
METRIC RANK
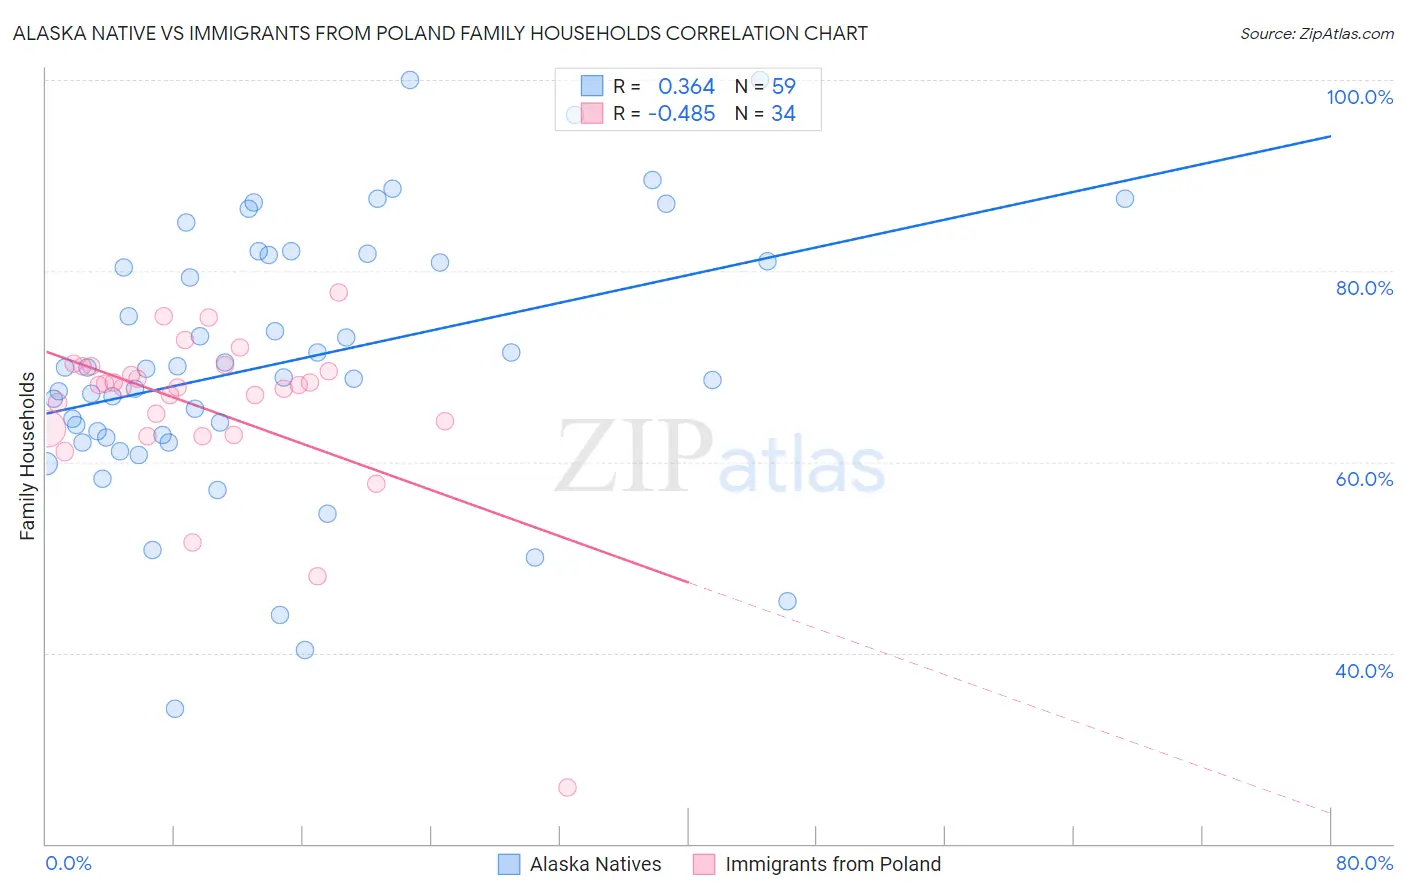
Alaska Native vs Immigrants from Poland Family Households Correlation Chart
The statistical analysis conducted on geographies consisting of 76,756,415 people shows a mild positive correlation between the proportion of Alaska Natives and percentage of family households in the United States with a correlation coefficient (R) of 0.364 and weighted average of 65.1%. Similarly, the statistical analysis conducted on geographies consisting of 304,786,496 people shows a moderate negative correlation between the proportion of Immigrants from Poland and percentage of family households in the United States with a correlation coefficient (R) of -0.485 and weighted average of 65.2%, a difference of 0.25%.
Family Households Correlation Summary
| Measurement | Alaska Native | Immigrants from Poland |
| Minimum | 34.1% | 25.9% |
| Maximum | 100.0% | 77.7% |
| Range | 65.9% | 51.8% |
| Mean | 70.5% | 65.6% |
| Median | 69.7% | 67.9% |
| Interquartile 25% (IQ1) | 62.6% | 63.4% |
| Interquartile 75% (IQ3) | 81.7% | 70.0% |
| Interquartile Range (IQR) | 19.1% | 6.6% |
| Standard Deviation (Sample) | 14.0% | 9.2% |
| Standard Deviation (Population) | 13.9% | 9.0% |
Demographics Similar to Alaska Natives and Immigrants from Poland by Family Households
In terms of family households, the demographic groups most similar to Alaska Natives are White/Caucasian (65.1%, a difference of 0.0%), English (65.1%, a difference of 0.010%), Palestinian (65.1%, a difference of 0.010%), Immigrants from Guatemala (65.0%, a difference of 0.050%), and Scandinavian (65.0%, a difference of 0.060%). Similarly, the demographic groups most similar to Immigrants from Poland are Hopi (65.3%, a difference of 0.020%), Guyanese (65.3%, a difference of 0.020%), Immigrants from Portugal (65.2%, a difference of 0.030%), Swiss (65.2%, a difference of 0.030%), and Guatemalan (65.2%, a difference of 0.030%).
| Demographics | Rating | Rank | Family Households |
| Immigrants | Laos | 99.1 /100 | #90 | Exceptional 65.3% |
| Crow | 98.9 /100 | #91 | Exceptional 65.3% |
| Hopi | 98.8 /100 | #92 | Exceptional 65.3% |
| Guyanese | 98.8 /100 | #93 | Exceptional 65.3% |
| Immigrants | Poland | 98.7 /100 | #94 | Exceptional 65.2% |
| Immigrants | Portugal | 98.6 /100 | #95 | Exceptional 65.2% |
| Swiss | 98.6 /100 | #96 | Exceptional 65.2% |
| Guatemalans | 98.6 /100 | #97 | Exceptional 65.2% |
| Immigrants | Syria | 98.4 /100 | #98 | Exceptional 65.2% |
| Central American Indians | 98.3 /100 | #99 | Exceptional 65.2% |
| Haitians | 98.1 /100 | #100 | Exceptional 65.2% |
| Chileans | 98.1 /100 | #101 | Exceptional 65.2% |
| Immigrants | Sri Lanka | 98.0 /100 | #102 | Exceptional 65.1% |
| Indians (Asian) | 97.9 /100 | #103 | Exceptional 65.1% |
| Spaniards | 97.8 /100 | #104 | Exceptional 65.1% |
| English | 97.4 /100 | #105 | Exceptional 65.1% |
| Whites/Caucasians | 97.3 /100 | #106 | Exceptional 65.1% |
| Alaska Natives | 97.3 /100 | #107 | Exceptional 65.1% |
| Palestinians | 97.2 /100 | #108 | Exceptional 65.1% |
| Immigrants | Guatemala | 96.9 /100 | #109 | Exceptional 65.0% |
| Scandinavians | 96.8 /100 | #110 | Exceptional 65.0% |