African vs Korean Average Family Size
COMPARE
African
Korean
Average Family Size
Average Family Size Comparison
Africans
Koreans
3.25
AVERAGE FAMILY SIZE
84.9/ 100
METRIC RATING
134th/ 347
METRIC RANK
3.36
AVERAGE FAMILY SIZE
100.0/ 100
METRIC RATING
53rd/ 347
METRIC RANK
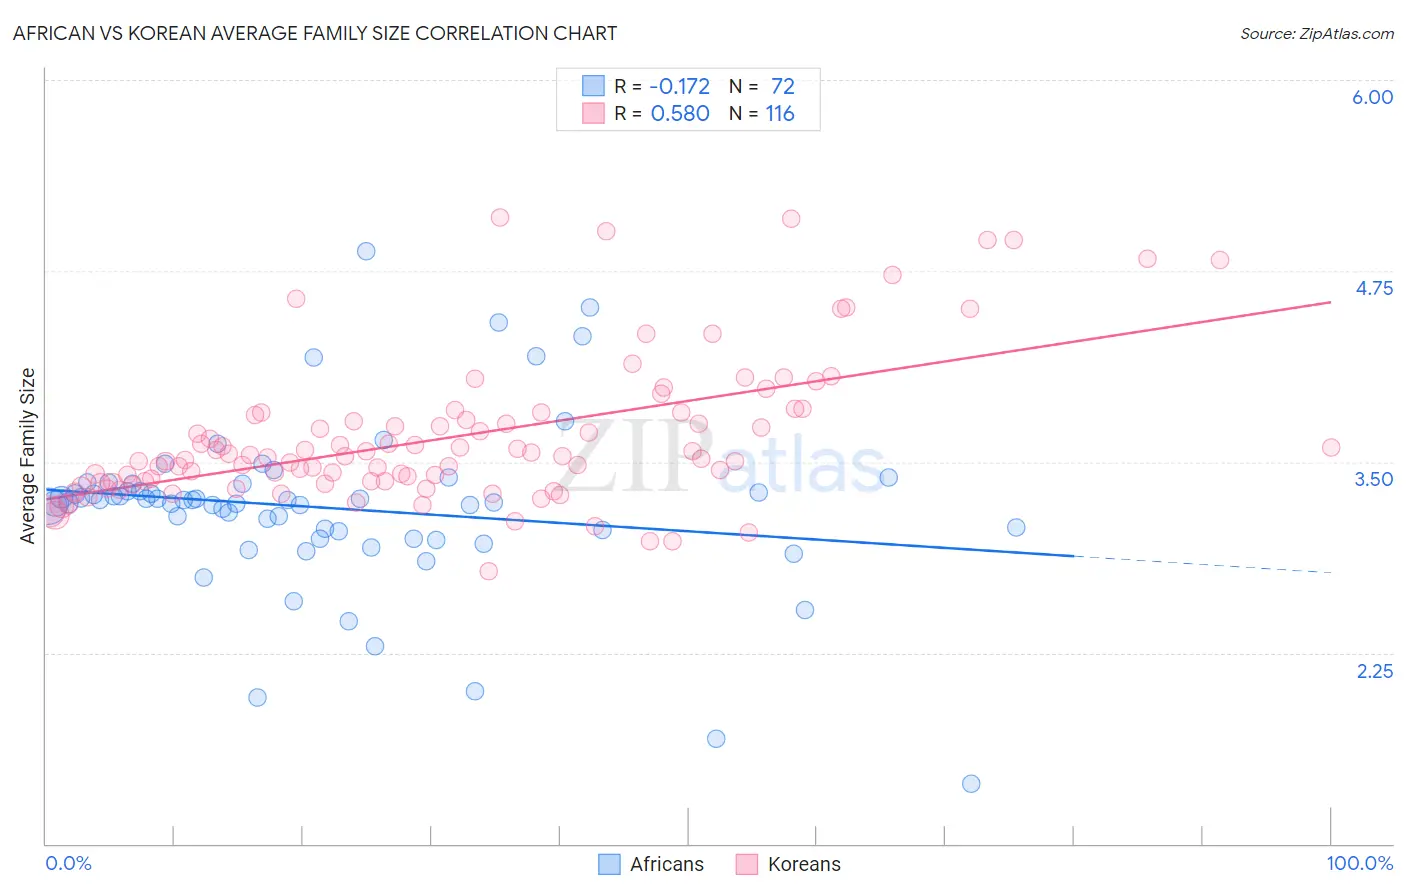
African vs Korean Average Family Size Correlation Chart
The statistical analysis conducted on geographies consisting of 469,598,302 people shows a poor negative correlation between the proportion of Africans and average family size in the United States with a correlation coefficient (R) of -0.172 and weighted average of 3.25. Similarly, the statistical analysis conducted on geographies consisting of 510,405,149 people shows a substantial positive correlation between the proportion of Koreans and average family size in the United States with a correlation coefficient (R) of 0.580 and weighted average of 3.36, a difference of 3.2%.
Average Family Size Correlation Summary
| Measurement | African | Korean |
| Minimum | 1.39 | 2.78 |
| Maximum | 4.88 | 5.10 |
| Range | 3.49 | 2.32 |
| Mean | 3.20 | 3.66 |
| Median | 3.24 | 3.54 |
| Interquartile 25% (IQ1) | 3.02 | 3.37 |
| Interquartile 75% (IQ3) | 3.33 | 3.81 |
| Interquartile Range (IQR) | 0.31 | 0.45 |
| Standard Deviation (Sample) | 0.56 | 0.47 |
| Standard Deviation (Population) | 0.55 | 0.47 |
Similar Demographics by Average Family Size
Demographics Similar to Africans by Average Family Size
In terms of average family size, the demographic groups most similar to Africans are Panamanian (3.25, a difference of 0.020%), Immigrants from Venezuela (3.26, a difference of 0.050%), Costa Rican (3.26, a difference of 0.070%), Comanche (3.25, a difference of 0.070%), and Immigrants from Middle Africa (3.25, a difference of 0.080%).
| Demographics | Rating | Rank | Average Family Size |
| Immigrants | Syria | 90.6 /100 | #127 | Exceptional 3.26 |
| Colombians | 89.9 /100 | #128 | Excellent 3.26 |
| Immigrants | Hong Kong | 88.6 /100 | #129 | Excellent 3.26 |
| Laotians | 88.5 /100 | #130 | Excellent 3.26 |
| Immigrants | Western Asia | 87.7 /100 | #131 | Excellent 3.26 |
| Costa Ricans | 86.8 /100 | #132 | Excellent 3.26 |
| Immigrants | Venezuela | 86.3 /100 | #133 | Excellent 3.26 |
| Africans | 84.9 /100 | #134 | Excellent 3.25 |
| Panamanians | 84.2 /100 | #135 | Excellent 3.25 |
| Comanche | 82.8 /100 | #136 | Excellent 3.25 |
| Immigrants | Middle Africa | 82.4 /100 | #137 | Excellent 3.25 |
| Cubans | 81.8 /100 | #138 | Excellent 3.25 |
| Immigrants | Ethiopia | 81.6 /100 | #139 | Excellent 3.25 |
| Sub-Saharan Africans | 81.6 /100 | #140 | Excellent 3.25 |
| Venezuelans | 81.4 /100 | #141 | Excellent 3.25 |
Demographics Similar to Koreans by Average Family Size
In terms of average family size, the demographic groups most similar to Koreans are Immigrants from South Eastern Asia (3.36, a difference of 0.020%), Fijian (3.36, a difference of 0.030%), Immigrants from Honduras (3.36, a difference of 0.060%), Nicaraguan (3.36, a difference of 0.090%), and Immigrants from Dominican Republic (3.35, a difference of 0.12%).
| Demographics | Rating | Rank | Average Family Size |
| Haitians | 100.0 /100 | #46 | Exceptional 3.37 |
| Vietnamese | 100.0 /100 | #47 | Exceptional 3.37 |
| Immigrants | Nicaragua | 100.0 /100 | #48 | Exceptional 3.37 |
| Bangladeshis | 100.0 /100 | #49 | Exceptional 3.37 |
| Immigrants | Bangladesh | 100.0 /100 | #50 | Exceptional 3.36 |
| Nicaraguans | 100.0 /100 | #51 | Exceptional 3.36 |
| Fijians | 100.0 /100 | #52 | Exceptional 3.36 |
| Koreans | 100.0 /100 | #53 | Exceptional 3.36 |
| Immigrants | South Eastern Asia | 100.0 /100 | #54 | Exceptional 3.36 |
| Immigrants | Honduras | 100.0 /100 | #55 | Exceptional 3.36 |
| Immigrants | Dominican Republic | 100.0 /100 | #56 | Exceptional 3.35 |
| Sri Lankans | 100.0 /100 | #57 | Exceptional 3.35 |
| Hondurans | 100.0 /100 | #58 | Exceptional 3.35 |
| Japanese | 100.0 /100 | #59 | Exceptional 3.35 |
| Immigrants | Armenia | 100.0 /100 | #60 | Exceptional 3.35 |