Czech vs Korean Currently Married
COMPARE
Czech
Korean
Currently Married
Currently Married Comparison
Czechs
Koreans
49.9%
CURRENTLY MARRIED
99.9/ 100
METRIC RATING
9th/ 347
METRIC RANK
47.9%
CURRENTLY MARRIED
95.4/ 100
METRIC RATING
92nd/ 347
METRIC RANK
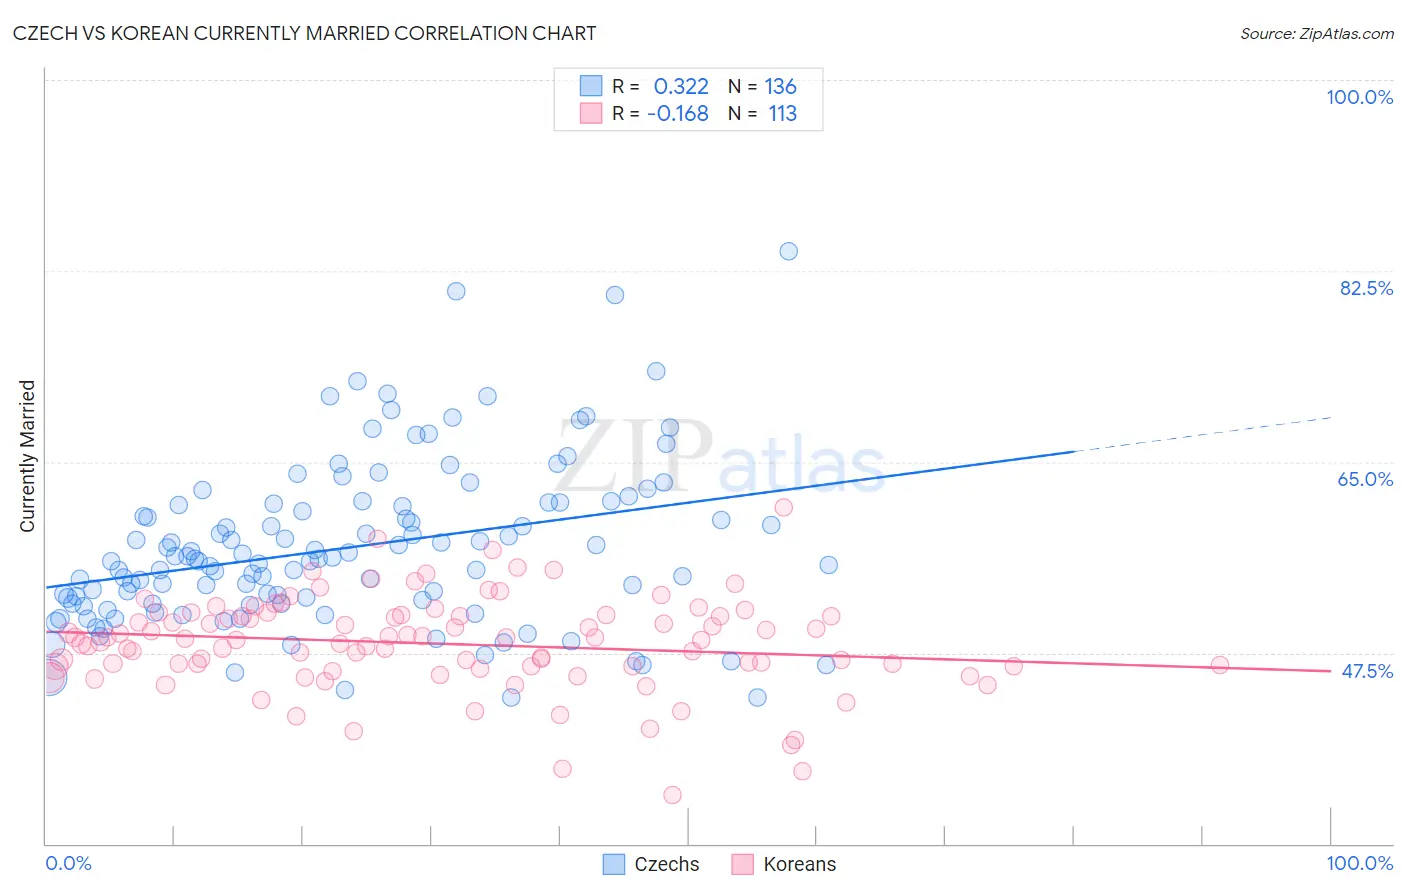
Czech vs Korean Currently Married Correlation Chart
The statistical analysis conducted on geographies consisting of 484,743,369 people shows a mild positive correlation between the proportion of Czechs and percentage of population currently married in the United States with a correlation coefficient (R) of 0.322 and weighted average of 49.9%. Similarly, the statistical analysis conducted on geographies consisting of 510,845,444 people shows a poor negative correlation between the proportion of Koreans and percentage of population currently married in the United States with a correlation coefficient (R) of -0.168 and weighted average of 47.9%, a difference of 4.0%.
Currently Married Correlation Summary
| Measurement | Czech | Korean |
| Minimum | 43.4% | 34.5% |
| Maximum | 84.3% | 60.8% |
| Range | 40.9% | 26.3% |
| Mean | 57.1% | 48.3% |
| Median | 56.0% | 48.7% |
| Interquartile 25% (IQ1) | 52.0% | 46.3% |
| Interquartile 75% (IQ3) | 61.1% | 50.9% |
| Interquartile Range (IQR) | 9.1% | 4.7% |
| Standard Deviation (Sample) | 7.5% | 4.3% |
| Standard Deviation (Population) | 7.5% | 4.3% |
Similar Demographics by Currently Married
Demographics Similar to Czechs by Currently Married
In terms of currently married, the demographic groups most similar to Czechs are Swedish (50.0%, a difference of 0.19%), Filipino (49.7%, a difference of 0.26%), English (49.7%, a difference of 0.27%), Swiss (49.7%, a difference of 0.27%), and Immigrants from South Central Asia (50.0%, a difference of 0.32%).
| Demographics | Rating | Rank | Currently Married |
| Thais | 100.0 /100 | #2 | Exceptional 50.9% |
| Assyrians/Chaldeans/Syriacs | 100.0 /100 | #3 | Exceptional 50.8% |
| Immigrants | Taiwan | 100.0 /100 | #4 | Exceptional 50.7% |
| Danes | 100.0 /100 | #5 | Exceptional 50.5% |
| Norwegians | 100.0 /100 | #6 | Exceptional 50.2% |
| Immigrants | South Central Asia | 100.0 /100 | #7 | Exceptional 50.0% |
| Swedes | 100.0 /100 | #8 | Exceptional 50.0% |
| Czechs | 99.9 /100 | #9 | Exceptional 49.9% |
| Filipinos | 99.9 /100 | #10 | Exceptional 49.7% |
| English | 99.9 /100 | #11 | Exceptional 49.7% |
| Swiss | 99.9 /100 | #12 | Exceptional 49.7% |
| Dutch | 99.9 /100 | #13 | Exceptional 49.6% |
| Germans | 99.9 /100 | #14 | Exceptional 49.6% |
| Pennsylvania Germans | 99.9 /100 | #15 | Exceptional 49.6% |
| Chinese | 99.9 /100 | #16 | Exceptional 49.5% |
Demographics Similar to Koreans by Currently Married
In terms of currently married, the demographic groups most similar to Koreans are Immigrants from Bolivia (47.9%, a difference of 0.040%), Lebanese (47.9%, a difference of 0.050%), American (48.0%, a difference of 0.070%), Native Hawaiian (47.9%, a difference of 0.070%), and Indian (Asian) (48.0%, a difference of 0.090%).
| Demographics | Rating | Rank | Currently Married |
| French Canadians | 96.3 /100 | #85 | Exceptional 48.0% |
| Immigrants | Japan | 96.2 /100 | #86 | Exceptional 48.0% |
| Jordanians | 96.2 /100 | #87 | Exceptional 48.0% |
| Immigrants | Eastern Europe | 96.1 /100 | #88 | Exceptional 48.0% |
| Indians (Asian) | 95.8 /100 | #89 | Exceptional 48.0% |
| Americans | 95.7 /100 | #90 | Exceptional 48.0% |
| Immigrants | Bolivia | 95.6 /100 | #91 | Exceptional 47.9% |
| Koreans | 95.4 /100 | #92 | Exceptional 47.9% |
| Lebanese | 95.1 /100 | #93 | Exceptional 47.9% |
| Native Hawaiians | 95.0 /100 | #94 | Exceptional 47.9% |
| Immigrants | Bulgaria | 94.8 /100 | #95 | Exceptional 47.9% |
| Egyptians | 94.8 /100 | #96 | Exceptional 47.9% |
| Immigrants | Ukraine | 94.8 /100 | #97 | Exceptional 47.9% |
| Immigrants | China | 94.7 /100 | #98 | Exceptional 47.9% |
| Immigrants | Sweden | 94.3 /100 | #99 | Exceptional 47.8% |