Brazilian vs Korean Currently Married
COMPARE
Brazilian
Korean
Currently Married
Currently Married Comparison
Brazilians
Koreans
46.4%
CURRENTLY MARRIED
39.3/ 100
METRIC RATING
184th/ 347
METRIC RANK
47.9%
CURRENTLY MARRIED
95.4/ 100
METRIC RATING
92nd/ 347
METRIC RANK
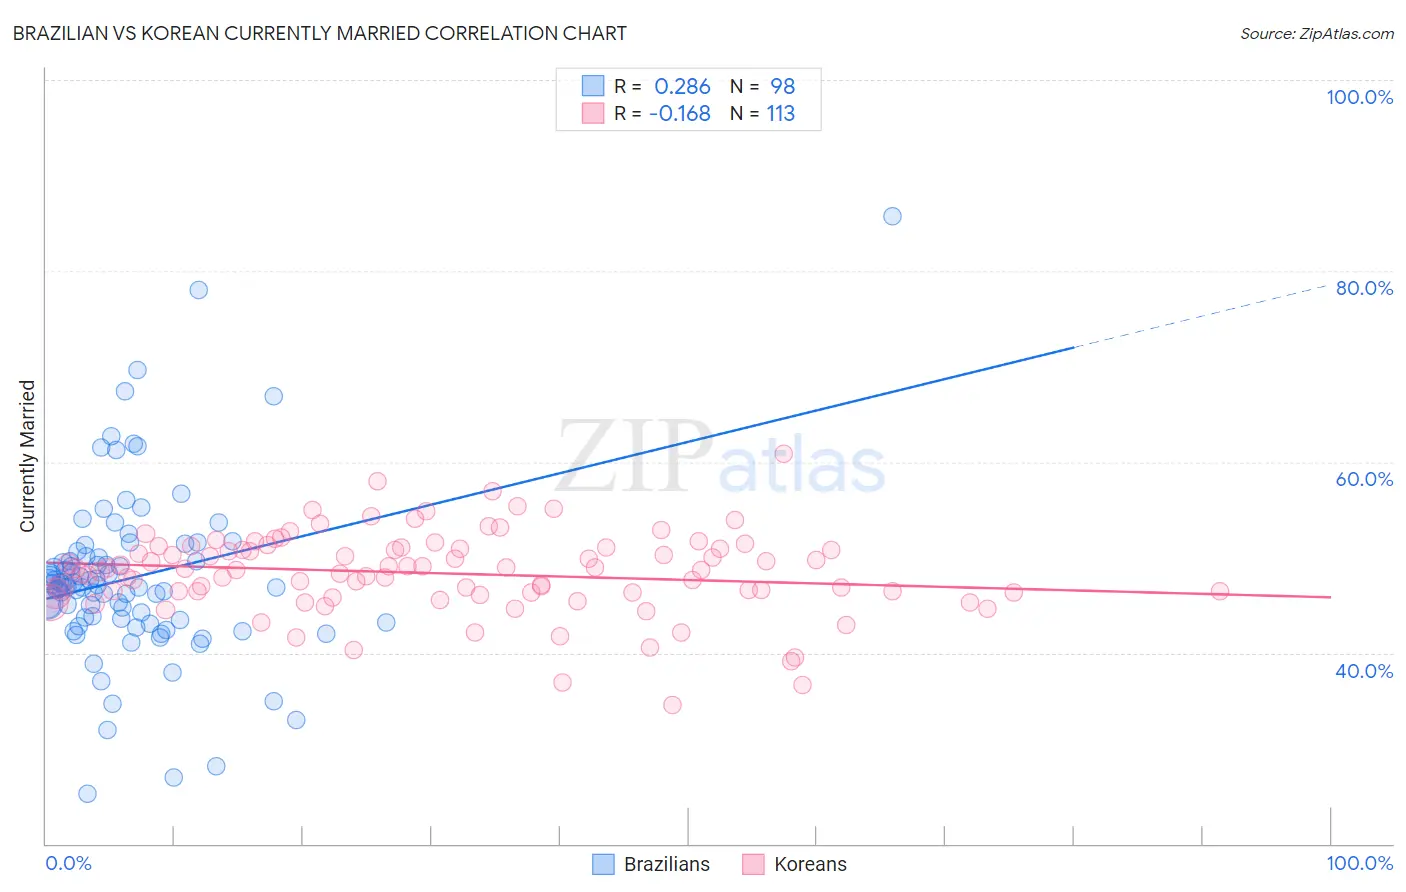
Brazilian vs Korean Currently Married Correlation Chart
The statistical analysis conducted on geographies consisting of 323,904,544 people shows a weak positive correlation between the proportion of Brazilians and percentage of population currently married in the United States with a correlation coefficient (R) of 0.286 and weighted average of 46.4%. Similarly, the statistical analysis conducted on geographies consisting of 510,845,444 people shows a poor negative correlation between the proportion of Koreans and percentage of population currently married in the United States with a correlation coefficient (R) of -0.168 and weighted average of 47.9%, a difference of 3.2%.
Currently Married Correlation Summary
| Measurement | Brazilian | Korean |
| Minimum | 25.3% | 34.5% |
| Maximum | 85.7% | 60.8% |
| Range | 60.4% | 26.3% |
| Mean | 47.9% | 48.3% |
| Median | 47.2% | 48.7% |
| Interquartile 25% (IQ1) | 43.5% | 46.3% |
| Interquartile 75% (IQ3) | 50.1% | 50.9% |
| Interquartile Range (IQR) | 6.6% | 4.7% |
| Standard Deviation (Sample) | 9.1% | 4.3% |
| Standard Deviation (Population) | 9.1% | 4.3% |
Similar Demographics by Currently Married
Demographics Similar to Brazilians by Currently Married
In terms of currently married, the demographic groups most similar to Brazilians are Immigrants from Northern Africa (46.5%, a difference of 0.020%), Mongolian (46.4%, a difference of 0.070%), Potawatomi (46.5%, a difference of 0.10%), Immigrants from Chile (46.4%, a difference of 0.10%), and Ottawa (46.5%, a difference of 0.14%).
| Demographics | Rating | Rank | Currently Married |
| Israelis | 48.6 /100 | #177 | Average 46.6% |
| Chickasaw | 47.8 /100 | #178 | Average 46.6% |
| Immigrants | Oceania | 44.6 /100 | #179 | Average 46.5% |
| Costa Ricans | 43.7 /100 | #180 | Average 46.5% |
| Ottawa | 43.0 /100 | #181 | Average 46.5% |
| Potawatomi | 41.9 /100 | #182 | Average 46.5% |
| Immigrants | Northern Africa | 39.7 /100 | #183 | Fair 46.5% |
| Brazilians | 39.3 /100 | #184 | Fair 46.4% |
| Mongolians | 37.6 /100 | #185 | Fair 46.4% |
| Immigrants | Chile | 36.8 /100 | #186 | Fair 46.4% |
| Immigrants | Peru | 35.3 /100 | #187 | Fair 46.4% |
| Colombians | 31.8 /100 | #188 | Fair 46.3% |
| Fijians | 30.3 /100 | #189 | Fair 46.3% |
| Choctaw | 29.1 /100 | #190 | Fair 46.3% |
| Immigrants | France | 27.7 /100 | #191 | Fair 46.2% |
Demographics Similar to Koreans by Currently Married
In terms of currently married, the demographic groups most similar to Koreans are Immigrants from Bolivia (47.9%, a difference of 0.040%), Lebanese (47.9%, a difference of 0.050%), American (48.0%, a difference of 0.070%), Native Hawaiian (47.9%, a difference of 0.070%), and Indian (Asian) (48.0%, a difference of 0.090%).
| Demographics | Rating | Rank | Currently Married |
| French Canadians | 96.3 /100 | #85 | Exceptional 48.0% |
| Immigrants | Japan | 96.2 /100 | #86 | Exceptional 48.0% |
| Jordanians | 96.2 /100 | #87 | Exceptional 48.0% |
| Immigrants | Eastern Europe | 96.1 /100 | #88 | Exceptional 48.0% |
| Indians (Asian) | 95.8 /100 | #89 | Exceptional 48.0% |
| Americans | 95.7 /100 | #90 | Exceptional 48.0% |
| Immigrants | Bolivia | 95.6 /100 | #91 | Exceptional 47.9% |
| Koreans | 95.4 /100 | #92 | Exceptional 47.9% |
| Lebanese | 95.1 /100 | #93 | Exceptional 47.9% |
| Native Hawaiians | 95.0 /100 | #94 | Exceptional 47.9% |
| Immigrants | Bulgaria | 94.8 /100 | #95 | Exceptional 47.9% |
| Egyptians | 94.8 /100 | #96 | Exceptional 47.9% |
| Immigrants | Ukraine | 94.8 /100 | #97 | Exceptional 47.9% |
| Immigrants | China | 94.7 /100 | #98 | Exceptional 47.9% |
| Immigrants | Sweden | 94.3 /100 | #99 | Exceptional 47.8% |