Yup'ik vs Ute 9th Grade
COMPARE
Yup'ik
Ute
9th Grade
9th Grade Comparison
Yup'ik
Ute
95.2%
9TH GRADE
83.3/ 100
METRIC RATING
144th/ 347
METRIC RANK
95.0%
9TH GRADE
62.6/ 100
METRIC RATING
166th/ 347
METRIC RANK
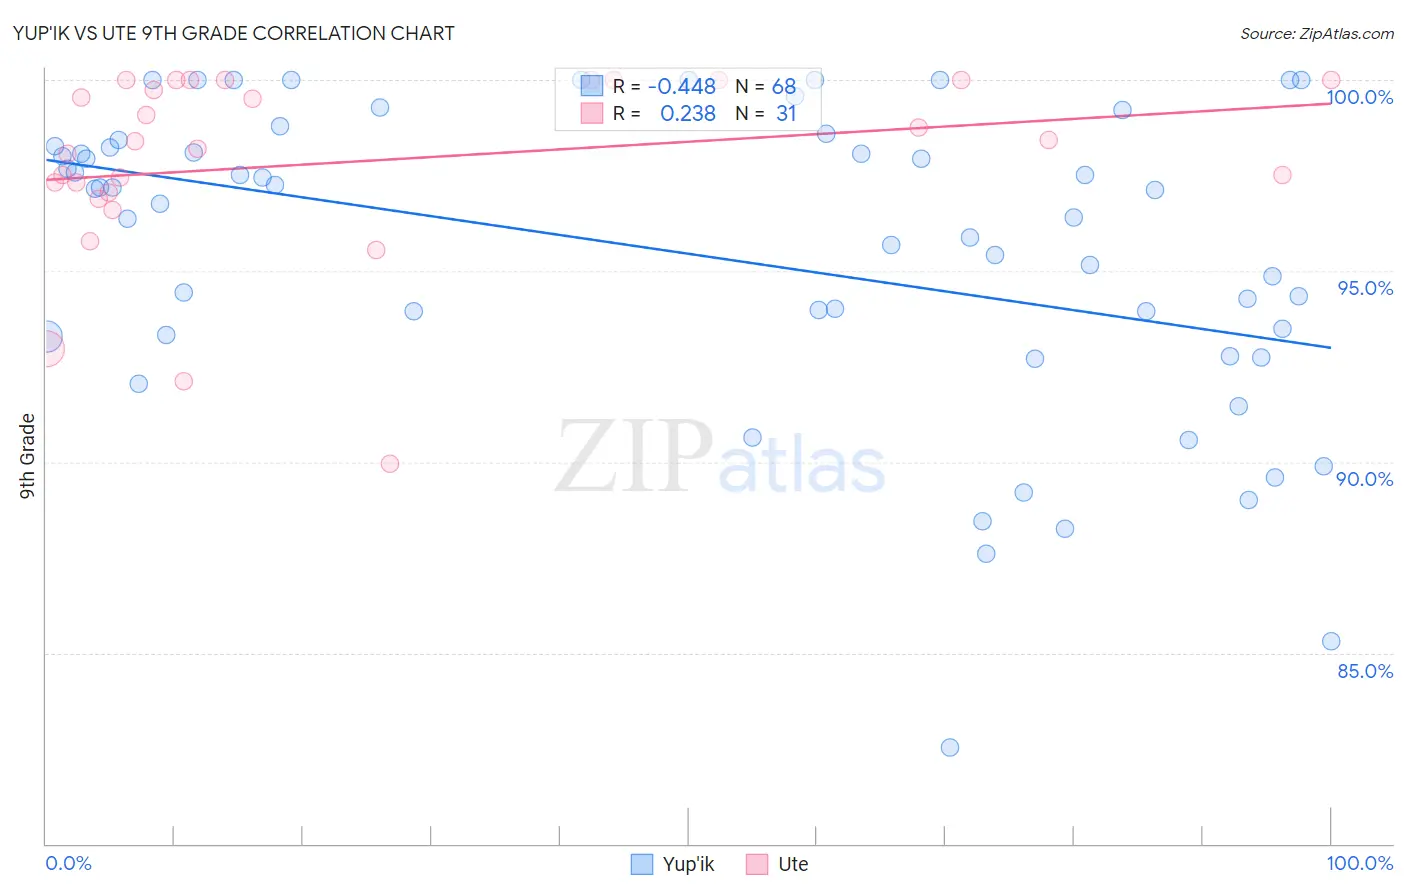
Yup'ik vs Ute 9th Grade Correlation Chart
The statistical analysis conducted on geographies consisting of 39,964,654 people shows a moderate negative correlation between the proportion of Yup'ik and percentage of population with at least 9th grade education in the United States with a correlation coefficient (R) of -0.448 and weighted average of 95.2%. Similarly, the statistical analysis conducted on geographies consisting of 55,668,539 people shows a weak positive correlation between the proportion of Ute and percentage of population with at least 9th grade education in the United States with a correlation coefficient (R) of 0.238 and weighted average of 95.0%, a difference of 0.20%.
9th Grade Correlation Summary
| Measurement | Yup'ik | Ute |
| Minimum | 82.5% | 89.9% |
| Maximum | 100.0% | 100.0% |
| Range | 17.5% | 10.1% |
| Mean | 95.4% | 97.9% |
| Median | 96.9% | 98.4% |
| Interquartile 25% (IQ1) | 93.3% | 97.0% |
| Interquartile 75% (IQ3) | 98.3% | 100.0% |
| Interquartile Range (IQR) | 5.0% | 3.0% |
| Standard Deviation (Sample) | 4.0% | 2.5% |
| Standard Deviation (Population) | 4.0% | 2.5% |
Similar Demographics by 9th Grade
Demographics Similar to Yup'ik by 9th Grade
In terms of 9th grade, the demographic groups most similar to Yup'ik are Spanish (95.2%, a difference of 0.010%), Immigrants from Greece (95.2%, a difference of 0.020%), Pueblo (95.1%, a difference of 0.020%), Immigrants from Sri Lanka (95.1%, a difference of 0.020%), and Choctaw (95.1%, a difference of 0.020%).
| Demographics | Rating | Rank | 9th Grade |
| Hmong | 87.7 /100 | #137 | Excellent 95.2% |
| Immigrants | Russia | 86.6 /100 | #138 | Excellent 95.2% |
| Immigrants | Eastern Europe | 85.8 /100 | #139 | Excellent 95.2% |
| Immigrants | Taiwan | 85.3 /100 | #140 | Excellent 95.2% |
| Immigrants | Bosnia and Herzegovina | 85.2 /100 | #141 | Excellent 95.2% |
| Immigrants | Greece | 84.6 /100 | #142 | Excellent 95.2% |
| Spanish | 84.4 /100 | #143 | Excellent 95.2% |
| Yup'ik | 83.3 /100 | #144 | Excellent 95.2% |
| Pueblo | 82.2 /100 | #145 | Excellent 95.1% |
| Immigrants | Sri Lanka | 82.1 /100 | #146 | Excellent 95.1% |
| Choctaw | 81.9 /100 | #147 | Excellent 95.1% |
| Immigrants | Jordan | 81.2 /100 | #148 | Excellent 95.1% |
| Immigrants | Korea | 79.6 /100 | #149 | Good 95.1% |
| Kenyans | 79.1 /100 | #150 | Good 95.1% |
| Cajuns | 77.3 /100 | #151 | Good 95.1% |
Demographics Similar to Ute by 9th Grade
In terms of 9th grade, the demographic groups most similar to Ute are Blackfeet (95.0%, a difference of 0.0%), Pakistani (95.0%, a difference of 0.010%), Venezuelan (95.0%, a difference of 0.010%), Immigrants from Brazil (95.0%, a difference of 0.010%), and Chilean (95.0%, a difference of 0.010%).
| Demographics | Rating | Rank | 9th Grade |
| Immigrants | Ukraine | 67.4 /100 | #159 | Good 95.0% |
| Immigrants | Italy | 66.6 /100 | #160 | Good 95.0% |
| French American Indians | 66.5 /100 | #161 | Good 95.0% |
| Bermudans | 65.8 /100 | #162 | Good 95.0% |
| Pakistanis | 64.1 /100 | #163 | Good 95.0% |
| Venezuelans | 63.6 /100 | #164 | Good 95.0% |
| Blackfeet | 62.6 /100 | #165 | Good 95.0% |
| Ute | 62.6 /100 | #166 | Good 95.0% |
| Immigrants | Brazil | 61.1 /100 | #167 | Good 95.0% |
| Chileans | 60.7 /100 | #168 | Good 95.0% |
| Spaniards | 59.6 /100 | #169 | Average 94.9% |
| Alsatians | 58.6 /100 | #170 | Average 94.9% |
| Colville | 58.5 /100 | #171 | Average 94.9% |
| Iraqis | 54.0 /100 | #172 | Average 94.9% |
| Cheyenne | 51.5 /100 | #173 | Average 94.9% |