Yup'ik vs Ute Associate's Degree
COMPARE
Yup'ik
Ute
Associate's Degree
Associate's Degree Comparison
Yup'ik
Ute
25.0%
ASSOCIATE'S DEGREE
0.0/ 100
METRIC RATING
347th/ 347
METRIC RANK
38.6%
ASSOCIATE'S DEGREE
0.0/ 100
METRIC RATING
299th/ 347
METRIC RANK
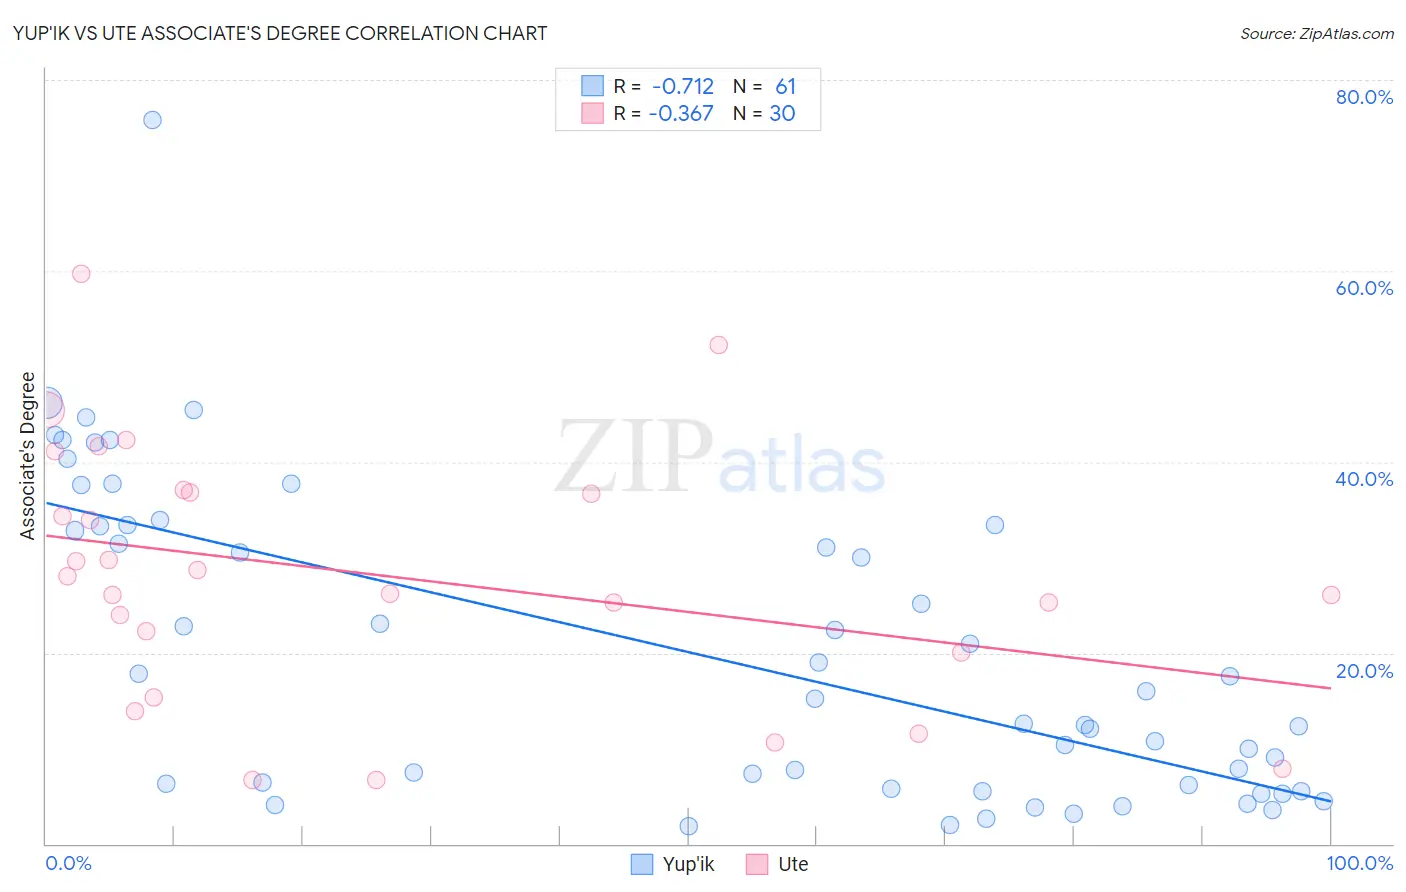
Yup'ik vs Ute Associate's Degree Correlation Chart
The statistical analysis conducted on geographies consisting of 39,962,242 people shows a strong negative correlation between the proportion of Yup'ik and percentage of population with at least associate's degree education in the United States with a correlation coefficient (R) of -0.712 and weighted average of 25.0%. Similarly, the statistical analysis conducted on geographies consisting of 55,668,197 people shows a mild negative correlation between the proportion of Ute and percentage of population with at least associate's degree education in the United States with a correlation coefficient (R) of -0.367 and weighted average of 38.6%, a difference of 54.7%.
Associate's Degree Correlation Summary
| Measurement | Yup'ik | Ute |
| Minimum | 1.8% | 6.7% |
| Maximum | 75.8% | 59.8% |
| Range | 74.0% | 53.1% |
| Mean | 20.1% | 28.2% |
| Median | 15.2% | 27.1% |
| Interquartile 25% (IQ1) | 5.9% | 20.0% |
| Interquartile 75% (IQ3) | 33.3% | 36.8% |
| Interquartile Range (IQR) | 27.4% | 16.8% |
| Standard Deviation (Sample) | 16.1% | 13.3% |
| Standard Deviation (Population) | 16.0% | 13.1% |
Similar Demographics by Associate's Degree
Demographics Similar to Yup'ik by Associate's Degree
In terms of associate's degree, the demographic groups most similar to Yup'ik are Houma (28.2%, a difference of 13.0%), Pima (30.2%, a difference of 21.1%), Yuman (31.3%, a difference of 25.2%), Tohono O'odham (31.8%, a difference of 27.3%), and Yakama (32.3%, a difference of 29.5%).
| Demographics | Rating | Rank | Associate's Degree |
| Mexicans | 0.0 /100 | #333 | Tragic 35.0% |
| Natives/Alaskans | 0.0 /100 | #334 | Tragic 34.9% |
| Spanish American Indians | 0.0 /100 | #335 | Tragic 34.9% |
| Hopi | 0.0 /100 | #336 | Tragic 34.6% |
| Lumbee | 0.0 /100 | #337 | Tragic 34.1% |
| Pueblo | 0.0 /100 | #338 | Tragic 34.0% |
| Immigrants | Mexico | 0.0 /100 | #339 | Tragic 33.7% |
| Navajo | 0.0 /100 | #340 | Tragic 32.6% |
| Inupiat | 0.0 /100 | #341 | Tragic 32.6% |
| Yakama | 0.0 /100 | #342 | Tragic 32.3% |
| Tohono O'odham | 0.0 /100 | #343 | Tragic 31.8% |
| Yuman | 0.0 /100 | #344 | Tragic 31.3% |
| Pima | 0.0 /100 | #345 | Tragic 30.2% |
| Houma | 0.0 /100 | #346 | Tragic 28.2% |
| Yup'ik | 0.0 /100 | #347 | Tragic 25.0% |
Demographics Similar to Ute by Associate's Degree
In terms of associate's degree, the demographic groups most similar to Ute are Chickasaw (38.6%, a difference of 0.040%), Cheyenne (38.7%, a difference of 0.090%), Tsimshian (38.6%, a difference of 0.090%), Colville (38.5%, a difference of 0.24%), and Guatemalan (38.5%, a difference of 0.33%).
| Demographics | Rating | Rank | Associate's Degree |
| Blacks/African Americans | 0.0 /100 | #292 | Tragic 39.1% |
| Nepalese | 0.0 /100 | #293 | Tragic 39.0% |
| Salvadorans | 0.0 /100 | #294 | Tragic 39.0% |
| Hondurans | 0.0 /100 | #295 | Tragic 38.9% |
| Cherokee | 0.0 /100 | #296 | Tragic 38.9% |
| Cape Verdeans | 0.0 /100 | #297 | Tragic 38.8% |
| Cheyenne | 0.0 /100 | #298 | Tragic 38.7% |
| Ute | 0.0 /100 | #299 | Tragic 38.6% |
| Chickasaw | 0.0 /100 | #300 | Tragic 38.6% |
| Tsimshian | 0.0 /100 | #301 | Tragic 38.6% |
| Colville | 0.0 /100 | #302 | Tragic 38.5% |
| Guatemalans | 0.0 /100 | #303 | Tragic 38.5% |
| Sioux | 0.0 /100 | #304 | Tragic 38.5% |
| Immigrants | Honduras | 0.0 /100 | #305 | Tragic 38.5% |
| Shoshone | 0.0 /100 | #306 | Tragic 38.4% |