Yup'ik vs Immigrants from Austria 9th Grade
COMPARE
Yup'ik
Immigrants from Austria
9th Grade
9th Grade Comparison
Yup'ik
Immigrants from Austria
95.2%
9TH GRADE
83.3/ 100
METRIC RATING
144th/ 347
METRIC RANK
96.0%
9TH GRADE
99.8/ 100
METRIC RATING
55th/ 347
METRIC RANK
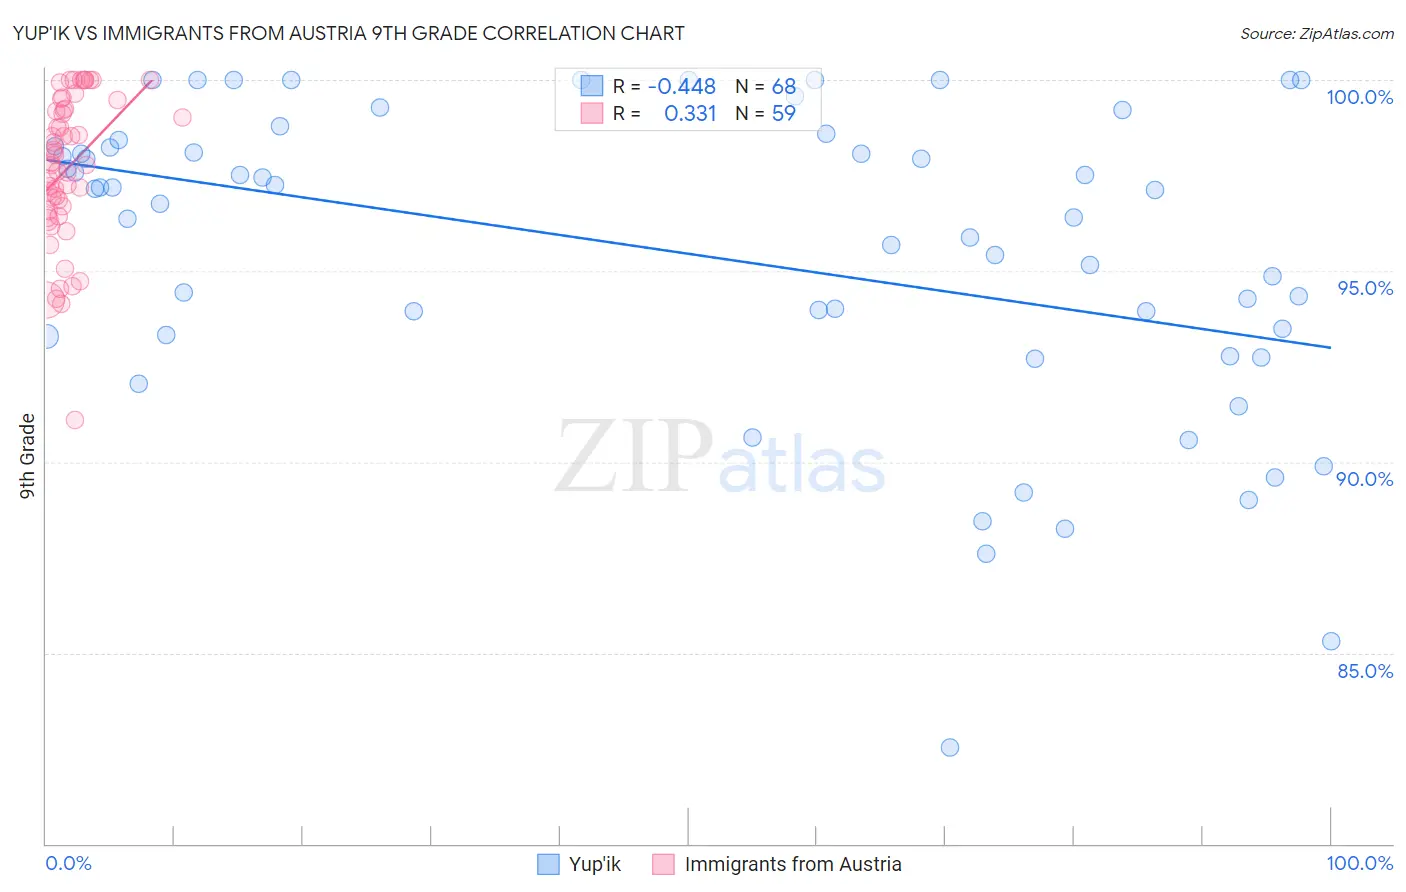
Yup'ik vs Immigrants from Austria 9th Grade Correlation Chart
The statistical analysis conducted on geographies consisting of 39,964,654 people shows a moderate negative correlation between the proportion of Yup'ik and percentage of population with at least 9th grade education in the United States with a correlation coefficient (R) of -0.448 and weighted average of 95.2%. Similarly, the statistical analysis conducted on geographies consisting of 167,973,751 people shows a mild positive correlation between the proportion of Immigrants from Austria and percentage of population with at least 9th grade education in the United States with a correlation coefficient (R) of 0.331 and weighted average of 96.0%, a difference of 0.86%.
9th Grade Correlation Summary
| Measurement | Yup'ik | Immigrants from Austria |
| Minimum | 82.5% | 91.1% |
| Maximum | 100.0% | 100.0% |
| Range | 17.5% | 8.9% |
| Mean | 95.4% | 97.7% |
| Median | 96.9% | 97.8% |
| Interquartile 25% (IQ1) | 93.3% | 96.6% |
| Interquartile 75% (IQ3) | 98.3% | 99.2% |
| Interquartile Range (IQR) | 5.0% | 2.7% |
| Standard Deviation (Sample) | 4.0% | 1.9% |
| Standard Deviation (Population) | 4.0% | 1.9% |
Similar Demographics by 9th Grade
Demographics Similar to Yup'ik by 9th Grade
In terms of 9th grade, the demographic groups most similar to Yup'ik are Spanish (95.2%, a difference of 0.010%), Immigrants from Greece (95.2%, a difference of 0.020%), Pueblo (95.1%, a difference of 0.020%), Immigrants from Sri Lanka (95.1%, a difference of 0.020%), and Choctaw (95.1%, a difference of 0.020%).
| Demographics | Rating | Rank | 9th Grade |
| Hmong | 87.7 /100 | #137 | Excellent 95.2% |
| Immigrants | Russia | 86.6 /100 | #138 | Excellent 95.2% |
| Immigrants | Eastern Europe | 85.8 /100 | #139 | Excellent 95.2% |
| Immigrants | Taiwan | 85.3 /100 | #140 | Excellent 95.2% |
| Immigrants | Bosnia and Herzegovina | 85.2 /100 | #141 | Excellent 95.2% |
| Immigrants | Greece | 84.6 /100 | #142 | Excellent 95.2% |
| Spanish | 84.4 /100 | #143 | Excellent 95.2% |
| Yup'ik | 83.3 /100 | #144 | Excellent 95.2% |
| Pueblo | 82.2 /100 | #145 | Excellent 95.1% |
| Immigrants | Sri Lanka | 82.1 /100 | #146 | Excellent 95.1% |
| Choctaw | 81.9 /100 | #147 | Excellent 95.1% |
| Immigrants | Jordan | 81.2 /100 | #148 | Excellent 95.1% |
| Immigrants | Korea | 79.6 /100 | #149 | Good 95.1% |
| Kenyans | 79.1 /100 | #150 | Good 95.1% |
| Cajuns | 77.3 /100 | #151 | Good 95.1% |
Demographics Similar to Immigrants from Austria by 9th Grade
In terms of 9th grade, the demographic groups most similar to Immigrants from Austria are Immigrants from North America (96.0%, a difference of 0.0%), Immigrants from Canada (96.0%, a difference of 0.010%), Macedonian (96.0%, a difference of 0.010%), Aleut (96.0%, a difference of 0.010%), and Austrian (96.0%, a difference of 0.020%).
| Demographics | Rating | Rank | 9th Grade |
| Australians | 99.9 /100 | #48 | Exceptional 96.0% |
| Greeks | 99.9 /100 | #49 | Exceptional 96.0% |
| Celtics | 99.9 /100 | #50 | Exceptional 96.0% |
| Immigrants | Northern Europe | 99.9 /100 | #51 | Exceptional 96.0% |
| Serbians | 99.9 /100 | #52 | Exceptional 96.0% |
| Austrians | 99.8 /100 | #53 | Exceptional 96.0% |
| Immigrants | Canada | 99.8 /100 | #54 | Exceptional 96.0% |
| Immigrants | Austria | 99.8 /100 | #55 | Exceptional 96.0% |
| Immigrants | North America | 99.8 /100 | #56 | Exceptional 96.0% |
| Macedonians | 99.8 /100 | #57 | Exceptional 96.0% |
| Aleuts | 99.8 /100 | #58 | Exceptional 96.0% |
| New Zealanders | 99.8 /100 | #59 | Exceptional 95.9% |
| Native Hawaiians | 99.8 /100 | #60 | Exceptional 95.9% |
| Sioux | 99.8 /100 | #61 | Exceptional 95.9% |
| Ukrainians | 99.7 /100 | #62 | Exceptional 95.9% |