Yup'ik vs Asian 9th Grade

COMPARE

Yup'ik
Race
Ancestry
AfghanAfricanAlaska NativeAlaskan AthabascanAlbanianAleutAlsatianAmericanApacheArabArapahoArgentineanArmenianAssyrian/Chaldean/SyriacAustralianAustrianBahamianBangladeshiBarbadianBasqueBelgianBelizeanBermudanBhutaneseBlackfeetBolivianBrazilianBritishBritish West IndianBulgarianBurmeseCajunCambodianCanadianCape VerdeanCarpatho RusynCelticCentral AmericanCentral American IndianCherokeeCheyenneChickasawChileanChineseChippewaChoctawColombianColvilleComancheCosta RicanCreeCreekCroatianCrowCubanCypriotCzechCzechoslovakianDanishDelawareDominicanDutchDutch West IndianEastern EuropeanEcuadorianEgyptianEnglishEstonianEthiopianEuropeanFijianFilipinoFinnishFrenchFrench American IndianFrench CanadianGermanGerman RussianGhanaianGreekGuamanian/ChamorroGuatemalanGuyaneseHaitianHmongHonduranHopiHoumaHungarianIcelanderIndian (Asian)IndonesianInupiatIranianIraqiIrishIroquoisIsraeliItalianJamaicanJapaneseJordanianKenyanKiowaKoreanLaotianLatvianLebaneseLiberianLithuanianLumbeeLuxembourgerMacedonianMalaysianMalteseMarshalleseMenomineeMexicanMexican American IndianMongolianMoroccanNative HawaiianNavajoNepaleseNew ZealanderNicaraguanNigerianNorthern EuropeanNorwegianOkinawanOsageOttawaPaiutePakistaniPalestinianPanamanianParaguayanPennsylvania GermanPeruvianPimaPolishPortuguesePotawatomiPuebloPuerto RicanPuget Sound SalishRomanianRussianSalvadoranSamoanScandinavianScotch-IrishScottishSeminoleSenegaleseSerbianShoshoneSierra LeoneanSiouxSlavicSlovakSloveneSomaliSouth AfricanSouth AmericanSouth American IndianSoviet UnionSpaniardSpanishSpanish AmericanSpanish American IndianSri LankanSubsaharan AfricanSudaneseSwedishSwissSyrianTaiwaneseThaiTlingit-HaidaTohono O'OdhamTonganTrinidadian and TobagonianTsimshianTurkishU.S. Virgin IslanderUgandanUkrainianUruguayanUteVenezuelanVietnameseWelshWest IndianYakamaYaquiYugoslavianYumanYup'ikZimbabwean
Immigration
NonimmigrantsImmigrantsAfghanistanAfricaAlbaniaArgentinaArmeniaAsiaAustraliaAustriaBahamasBangladeshBarbadosBelarusBelgiumBelizeBoliviaBosnia and HerzegovinaBrazilBulgariaBurma/MyanmarCabo VerdeCambodiaCameroonCanadaCaribbeanCentral AmericaChileChinaColombiaCongoCosta RicaCroatiaCubaCzechoslovakiaDenmarkDominicaDominican RepublicEastern AfricaEastern AsiaEastern EuropeEcuadorEgyptEl SalvadorEnglandEritreaEthiopiaEuropeFijiFranceGermanyGhanaGreeceGrenadaGuatemalaGuyanaHaitiHondurasHong KongHungaryIndiaIndonesiaIranIraqIrelandIsraelItalyJamaicaJapanJordanKazakhstanKenyaKoreaKuwaitLaosLatin AmericaLatviaLebanonLiberiaLithuaniaMalaysiaMexicoMicronesiaMiddle AfricaMoldovaMoroccoNepalNetherlandsNicaraguaNigeriaNorth AmericaNorth MacedoniaNorthern AfricaNorthern EuropeNorwayOceaniaPakistanPanamaPeruPhilippinesPolandPortugalRomaniaRussiaSaudi ArabiaScotlandSenegalSerbiaSierra LeoneSingaporeSomaliaSouth AfricaSouth AmericaSouth Central AsiaSouth Eastern AsiaSouthern EuropeSpainSri LankaSt. Vincent and the GrenadinesSudanSwedenSwitzerlandSyriaTaiwanThailandTrinidad and TobagoTurkeyUgandaUkraineUruguayUzbekistanVenezuelaVietnamWest IndiesWestern AfricaWestern AsiaWestern EuropeYemenZaireZimbabweAzores
Asian
Race
Ancestry
AfghanAfricanAlaska NativeAlaskan AthabascanAlbanianAleutAlsatianAmericanApacheArabArapahoArgentineanArmenianAssyrian/Chaldean/SyriacAustralianAustrianBahamianBangladeshiBarbadianBasqueBelgianBelizeanBermudanBhutaneseBlackfeetBolivianBrazilianBritishBritish West IndianBulgarianBurmeseCajunCambodianCanadianCape VerdeanCarpatho RusynCelticCentral AmericanCentral American IndianCherokeeCheyenneChickasawChileanChineseChippewaChoctawColombianColvilleComancheCosta RicanCreeCreekCroatianCrowCubanCypriotCzechCzechoslovakianDanishDelawareDominicanDutchDutch West IndianEastern EuropeanEcuadorianEgyptianEnglishEstonianEthiopianEuropeanFijianFilipinoFinnishFrenchFrench American IndianFrench CanadianGermanGerman RussianGhanaianGreekGuamanian/ChamorroGuatemalanGuyaneseHaitianHmongHonduranHopiHoumaHungarianIcelanderIndian (Asian)IndonesianInupiatIranianIraqiIrishIroquoisIsraeliItalianJamaicanJapaneseJordanianKenyanKiowaKoreanLaotianLatvianLebaneseLiberianLithuanianLumbeeLuxembourgerMacedonianMalaysianMalteseMarshalleseMenomineeMexicanMexican American IndianMongolianMoroccanNative HawaiianNavajoNepaleseNew ZealanderNicaraguanNigerianNorthern EuropeanNorwegianOkinawanOsageOttawaPaiutePakistaniPalestinianPanamanianParaguayanPennsylvania GermanPeruvianPimaPolishPortuguesePotawatomiPuebloPuerto RicanPuget Sound SalishRomanianRussianSalvadoranSamoanScandinavianScotch-IrishScottishSeminoleSenegaleseSerbianShoshoneSierra LeoneanSiouxSlavicSlovakSloveneSomaliSouth AfricanSouth AmericanSouth American IndianSoviet UnionSpaniardSpanishSpanish AmericanSpanish American IndianSri LankanSubsaharan AfricanSudaneseSwedishSwissSyrianTaiwaneseThaiTlingit-HaidaTohono O'OdhamTonganTrinidadian and TobagonianTsimshianTurkishU.S. Virgin IslanderUgandanUkrainianUruguayanUteVenezuelanVietnameseWelshWest IndianYakamaYaquiYugoslavianYumanZimbabwean
Immigration
NonimmigrantsImmigrantsAfghanistanAfricaAlbaniaArgentinaArmeniaAsiaAustraliaAustriaBahamasBangladeshBarbadosBelarusBelgiumBelizeBoliviaBosnia and HerzegovinaBrazilBulgariaBurma/MyanmarCabo VerdeCambodiaCameroonCanadaCaribbeanCentral AmericaChileChinaColombiaCongoCosta RicaCroatiaCubaCzechoslovakiaDenmarkDominicaDominican RepublicEastern AfricaEastern AsiaEastern EuropeEcuadorEgyptEl SalvadorEnglandEritreaEthiopiaEuropeFijiFranceGermanyGhanaGreeceGrenadaGuatemalaGuyanaHaitiHondurasHong KongHungaryIndiaIndonesiaIranIraqIrelandIsraelItalyJamaicaJapanJordanKazakhstanKenyaKoreaKuwaitLaosLatin AmericaLatviaLebanonLiberiaLithuaniaMalaysiaMexicoMicronesiaMiddle AfricaMoldovaMoroccoNepalNetherlandsNicaraguaNigeriaNorth AmericaNorth MacedoniaNorthern AfricaNorthern EuropeNorwayOceaniaPakistanPanamaPeruPhilippinesPolandPortugalRomaniaRussiaSaudi ArabiaScotlandSenegalSerbiaSierra LeoneSingaporeSomaliaSouth AfricaSouth AmericaSouth Central AsiaSouth Eastern AsiaSouthern EuropeSpainSri LankaSt. Vincent and the GrenadinesSudanSwedenSwitzerlandSyriaTaiwanThailandTrinidad and TobagoTurkeyUgandaUkraineUruguayUzbekistanVenezuelaVietnamWest IndiesWestern AfricaWestern AsiaWestern EuropeYemenZaireZimbabweAzores
9th Grade
Income
Poverty
Unemployment
Labor Participation
Family Structure
Vehicle Availability
Education Level
Disability

9th Grade Comparison

Yup'ik

Asians

Excellent
Tragic
95.2%
9TH GRADE
83.3/ 100
METRIC RATING
144th/ 347
METRIC RANK
94.5%
9TH GRADE
9.9/ 100
METRIC RATING
217th/ 347
METRIC RANK

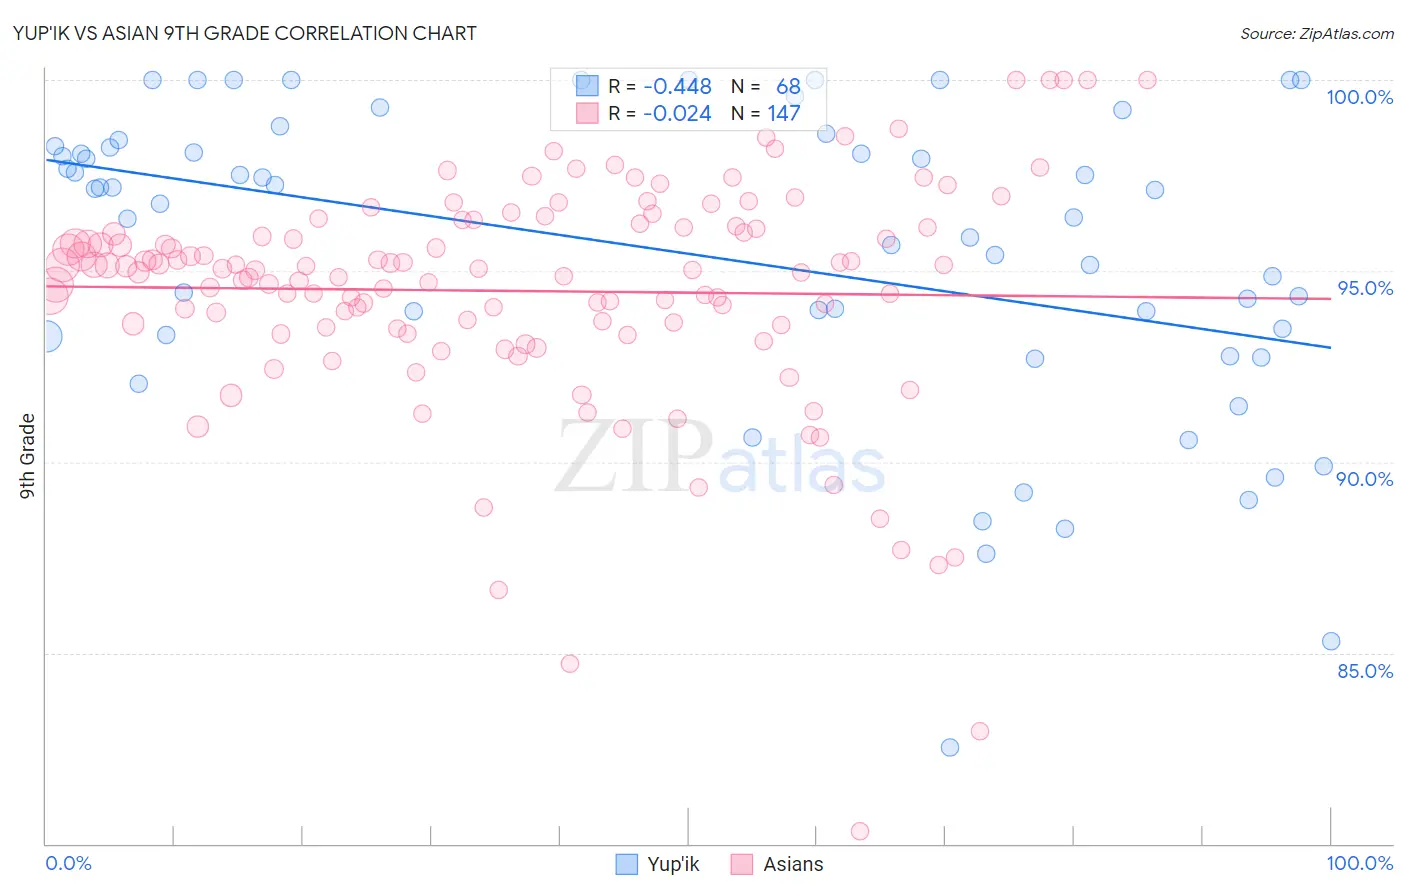
Yup'ik vs Asian 9th Grade Correlation Chart

The statistical analysis conducted on geographies consisting of 39,964,654 people shows a moderate negative correlation between the proportion of Yup'ik and percentage of population with at least 9th grade education in the United States with a correlation coefficient (R) of -0.448 and weighted average of 95.2%. Similarly, the statistical analysis conducted on geographies consisting of 550,857,622 people shows no correlation between the proportion of Asians and percentage of population with at least 9th grade education in the United States with a correlation coefficient (R) of -0.024 and weighted average of 94.5%, a difference of 0.70%.
Yup'ik vs Asian 9th Grade

9th Grade Correlation Summary

MeasurementYup'ikAsian
Minimum82.5%80.3%
Maximum100.0%100.0%
Range17.5%19.7%
Mean95.4%94.5%
Median96.9%95.0%
Interquartile 25% (IQ1)93.3%93.5%
Interquartile 75% (IQ3)98.3%96.2%
Interquartile Range (IQR)5.0%2.6%
Standard Deviation (Sample)4.0%3.0%
Standard Deviation (Population)4.0%3.0%

Similar Demographics by 9th Grade

Demographics Similar to Yup'ik by 9th Grade

In terms of 9th grade, the demographic groups most similar to Yup'ik are Spanish (95.2%, a difference of 0.010%), Immigrants from Greece (95.2%, a difference of 0.020%), Pueblo (95.1%, a difference of 0.020%), Immigrants from Sri Lanka (95.1%, a difference of 0.020%), and Choctaw (95.1%, a difference of 0.020%).
DemographicsRating | Rank9th Grade
Hmong
87.7
/100
|
#137
Excellent
95.2%
Immigrants | Russia
86.6
/100
|
#138
Excellent
95.2%
Immigrants | Eastern Europe
85.8
/100
|
#139
Excellent
95.2%
Immigrants | Taiwan
85.3
/100
|
#140
Excellent
95.2%
Immigrants | Bosnia and Herzegovina
85.2
/100
|
#141
Excellent
95.2%
Immigrants | Greece
84.6
/100
|
#142
Excellent
95.2%
Spanish
84.4
/100
|
#143
Excellent
95.2%
Yup'ik
83.3
/100
|
#144
Excellent
95.2%
Pueblo
82.2
/100
|
#145
Excellent
95.1%
Immigrants | Sri Lanka
82.1
/100
|
#146
Excellent
95.1%
Choctaw
81.9
/100
|
#147
Excellent
95.1%
Immigrants | Jordan
81.2
/100
|
#148
Excellent
95.1%
Immigrants | Korea
79.6
/100
|
#149
Good
95.1%
Kenyans
79.1
/100
|
#150
Good
95.1%
Cajuns
77.3
/100
|
#151
Good
95.1%

Demographics Similar to Asians by 9th Grade

In terms of 9th grade, the demographic groups most similar to Asians are Portuguese (94.5%, a difference of 0.010%), Immigrants from Syria (94.5%, a difference of 0.020%), Immigrants from Western Asia (94.5%, a difference of 0.020%), African (94.5%, a difference of 0.020%), and Indian (Asian) (94.5%, a difference of 0.030%).
DemographicsRating | Rank9th Grade
Immigrants | Chile
13.4
/100
|
#210
Poor
94.5%
Immigrants | Indonesia
12.3
/100
|
#211
Poor
94.5%
Immigrants | Malaysia
12.2
/100
|
#212
Poor
94.5%
Immigrants | Oceania
12.1
/100
|
#213
Poor
94.5%
Immigrants | Liberia
11.8
/100
|
#214
Poor
94.5%
Immigrants | Syria
11.0
/100
|
#215
Poor
94.5%
Immigrants | Western Asia
10.7
/100
|
#216
Poor
94.5%
Asians
9.9
/100
|
#217
Tragic
94.5%
Portuguese
9.2
/100
|
#218
Tragic
94.5%
Africans
9.0
/100
|
#219
Tragic
94.5%
Indians (Asian)
8.6
/100
|
#220
Tragic
94.5%
Immigrants | Eastern Africa
8.2
/100
|
#221
Tragic
94.5%
Immigrants | Asia
7.7
/100
|
#222
Tragic
94.4%
Bahamians
7.0
/100
|
#223
Tragic
94.4%
Tongans
6.0
/100
|
#224
Tragic
94.4%