Maltese vs Ute 9th Grade
COMPARE
Maltese
Ute
9th Grade
9th Grade Comparison
Maltese
Ute
96.3%
9TH GRADE
100.0/ 100
METRIC RATING
30th/ 347
METRIC RANK
95.0%
9TH GRADE
62.6/ 100
METRIC RATING
166th/ 347
METRIC RANK
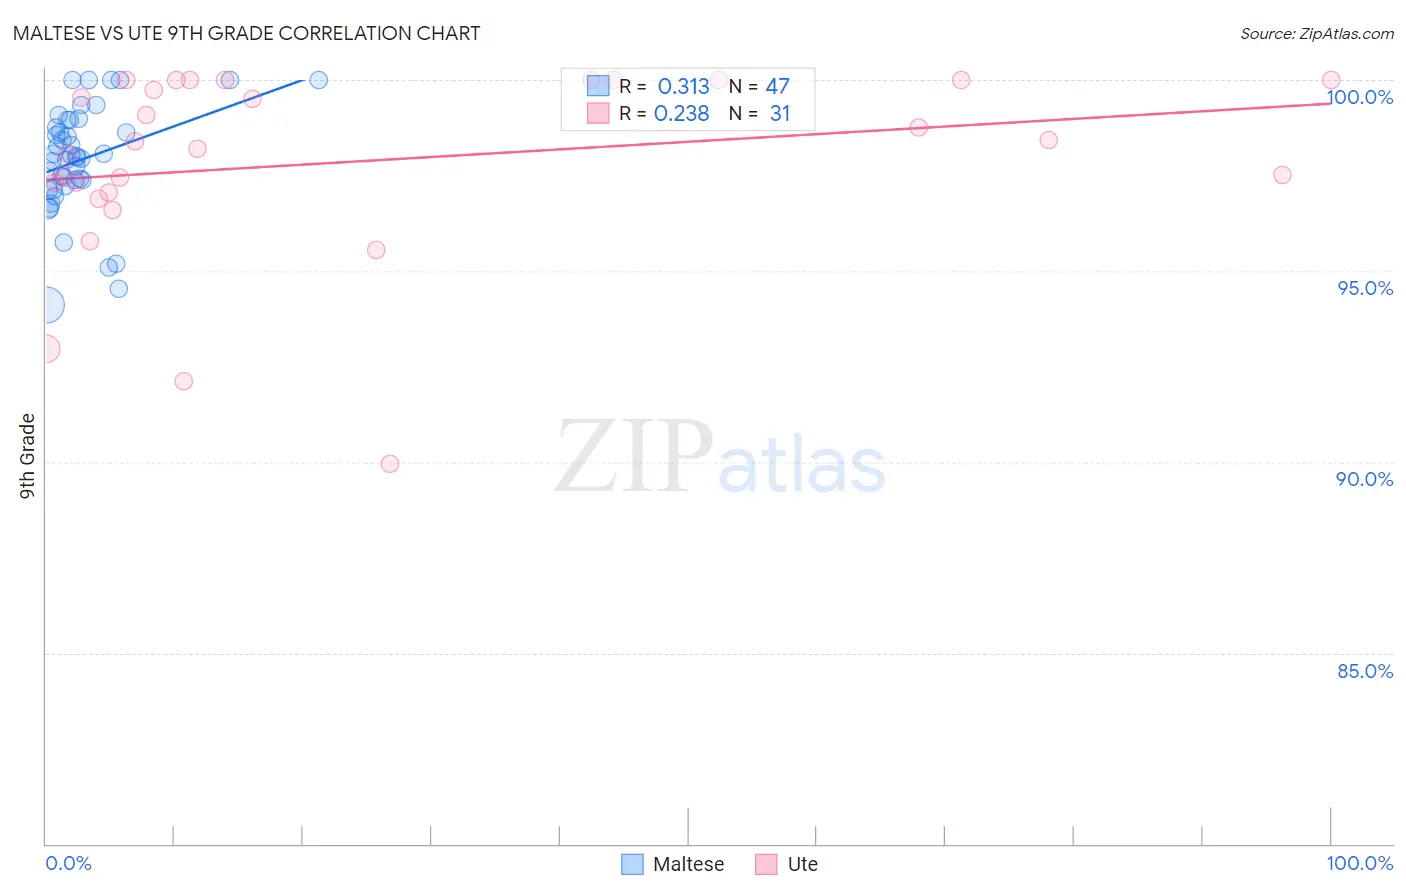
Maltese vs Ute 9th Grade Correlation Chart
The statistical analysis conducted on geographies consisting of 126,476,608 people shows a mild positive correlation between the proportion of Maltese and percentage of population with at least 9th grade education in the United States with a correlation coefficient (R) of 0.313 and weighted average of 96.3%. Similarly, the statistical analysis conducted on geographies consisting of 55,668,539 people shows a weak positive correlation between the proportion of Ute and percentage of population with at least 9th grade education in the United States with a correlation coefficient (R) of 0.238 and weighted average of 95.0%, a difference of 1.4%.
9th Grade Correlation Summary
| Measurement | Maltese | Ute |
| Minimum | 94.1% | 89.9% |
| Maximum | 100.0% | 100.0% |
| Range | 5.9% | 10.1% |
| Mean | 97.9% | 97.9% |
| Median | 98.0% | 98.4% |
| Interquartile 25% (IQ1) | 97.2% | 97.0% |
| Interquartile 75% (IQ3) | 99.0% | 100.0% |
| Interquartile Range (IQR) | 1.7% | 3.0% |
| Standard Deviation (Sample) | 1.4% | 2.5% |
| Standard Deviation (Population) | 1.4% | 2.5% |
Similar Demographics by 9th Grade
Demographics Similar to Maltese by 9th Grade
In terms of 9th grade, the demographic groups most similar to Maltese are British (96.3%, a difference of 0.0%), Belgian (96.3%, a difference of 0.010%), Chinese (96.3%, a difference of 0.020%), Luxembourger (96.3%, a difference of 0.020%), and Scotch-Irish (96.3%, a difference of 0.030%).
| Demographics | Rating | Rank | 9th Grade |
| Czechs | 100.0 /100 | #23 | Exceptional 96.4% |
| Latvians | 100.0 /100 | #24 | Exceptional 96.4% |
| French | 100.0 /100 | #25 | Exceptional 96.3% |
| French Canadians | 100.0 /100 | #26 | Exceptional 96.3% |
| Scotch-Irish | 100.0 /100 | #27 | Exceptional 96.3% |
| Eastern Europeans | 100.0 /100 | #28 | Exceptional 96.3% |
| Chinese | 100.0 /100 | #29 | Exceptional 96.3% |
| Maltese | 100.0 /100 | #30 | Exceptional 96.3% |
| British | 100.0 /100 | #31 | Exceptional 96.3% |
| Belgians | 100.0 /100 | #32 | Exceptional 96.3% |
| Luxembourgers | 100.0 /100 | #33 | Exceptional 96.3% |
| Hungarians | 100.0 /100 | #34 | Exceptional 96.2% |
| Bulgarians | 99.9 /100 | #35 | Exceptional 96.2% |
| Northern Europeans | 99.9 /100 | #36 | Exceptional 96.2% |
| Estonians | 99.9 /100 | #37 | Exceptional 96.1% |
Demographics Similar to Ute by 9th Grade
In terms of 9th grade, the demographic groups most similar to Ute are Blackfeet (95.0%, a difference of 0.0%), Pakistani (95.0%, a difference of 0.010%), Venezuelan (95.0%, a difference of 0.010%), Immigrants from Brazil (95.0%, a difference of 0.010%), and Chilean (95.0%, a difference of 0.010%).
| Demographics | Rating | Rank | 9th Grade |
| Immigrants | Ukraine | 67.4 /100 | #159 | Good 95.0% |
| Immigrants | Italy | 66.6 /100 | #160 | Good 95.0% |
| French American Indians | 66.5 /100 | #161 | Good 95.0% |
| Bermudans | 65.8 /100 | #162 | Good 95.0% |
| Pakistanis | 64.1 /100 | #163 | Good 95.0% |
| Venezuelans | 63.6 /100 | #164 | Good 95.0% |
| Blackfeet | 62.6 /100 | #165 | Good 95.0% |
| Ute | 62.6 /100 | #166 | Good 95.0% |
| Immigrants | Brazil | 61.1 /100 | #167 | Good 95.0% |
| Chileans | 60.7 /100 | #168 | Good 95.0% |
| Spaniards | 59.6 /100 | #169 | Average 94.9% |
| Alsatians | 58.6 /100 | #170 | Average 94.9% |
| Colville | 58.5 /100 | #171 | Average 94.9% |
| Iraqis | 54.0 /100 | #172 | Average 94.9% |
| Cheyenne | 51.5 /100 | #173 | Average 94.9% |