Immigrants from Hong Kong vs Ute 9th Grade
COMPARE
Immigrants from Hong Kong
Ute
9th Grade
9th Grade Comparison
Immigrants from Hong Kong
Ute
94.1%
9TH GRADE
1.3/ 100
METRIC RATING
250th/ 347
METRIC RANK
95.0%
9TH GRADE
62.6/ 100
METRIC RATING
166th/ 347
METRIC RANK
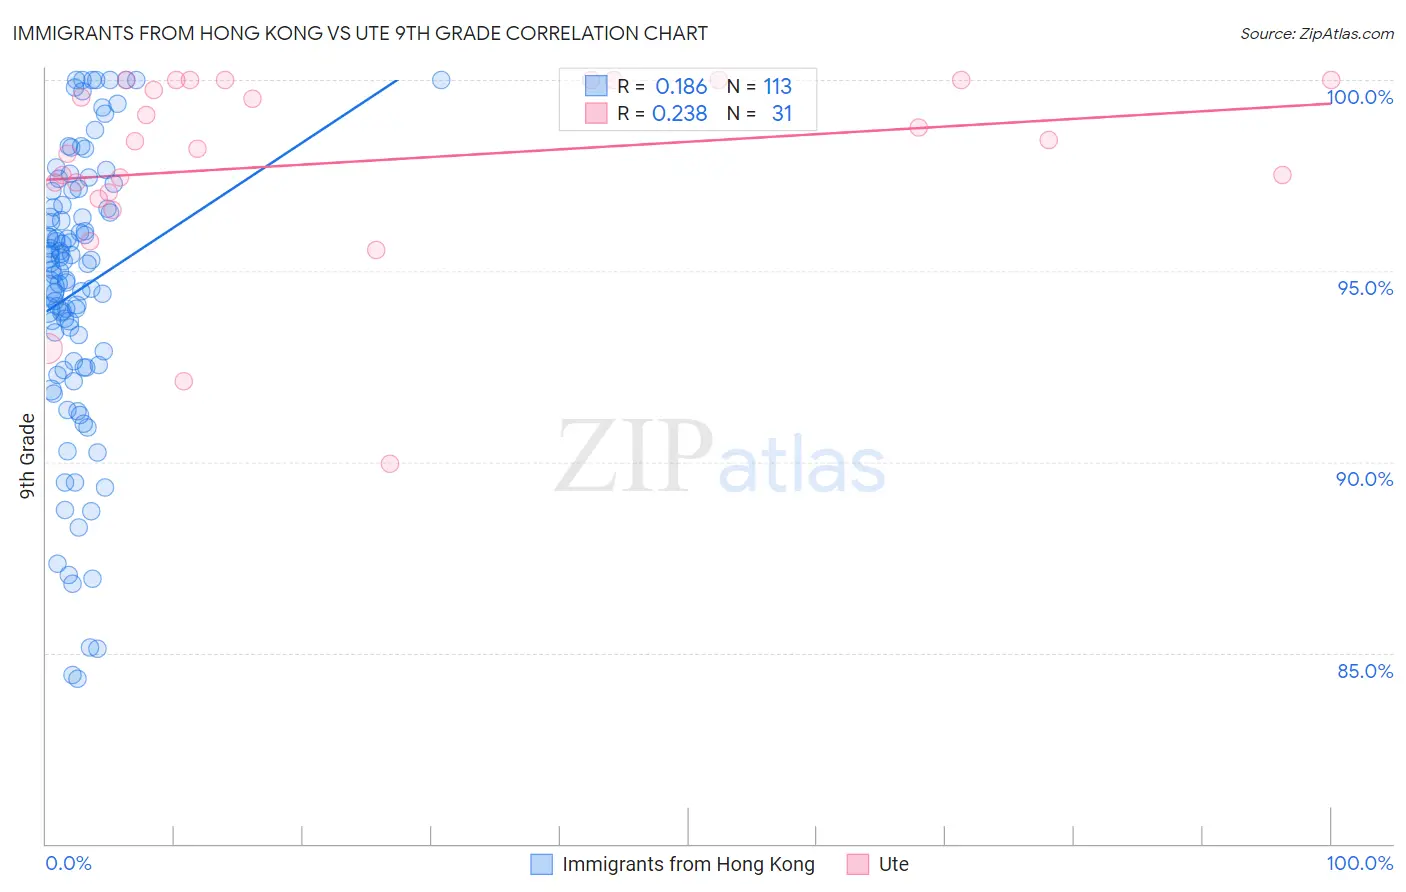
Immigrants from Hong Kong vs Ute 9th Grade Correlation Chart
The statistical analysis conducted on geographies consisting of 253,990,382 people shows a poor positive correlation between the proportion of Immigrants from Hong Kong and percentage of population with at least 9th grade education in the United States with a correlation coefficient (R) of 0.186 and weighted average of 94.1%. Similarly, the statistical analysis conducted on geographies consisting of 55,668,539 people shows a weak positive correlation between the proportion of Ute and percentage of population with at least 9th grade education in the United States with a correlation coefficient (R) of 0.238 and weighted average of 95.0%, a difference of 0.89%.
9th Grade Correlation Summary
| Measurement | Immigrants from Hong Kong | Ute |
| Minimum | 84.3% | 89.9% |
| Maximum | 100.0% | 100.0% |
| Range | 15.7% | 10.1% |
| Mean | 94.5% | 97.9% |
| Median | 95.0% | 98.4% |
| Interquartile 25% (IQ1) | 92.5% | 97.0% |
| Interquartile 75% (IQ3) | 96.7% | 100.0% |
| Interquartile Range (IQR) | 4.2% | 3.0% |
| Standard Deviation (Sample) | 3.7% | 2.5% |
| Standard Deviation (Population) | 3.7% | 2.5% |
Similar Demographics by 9th Grade
Demographics Similar to Immigrants from Hong Kong by 9th Grade
In terms of 9th grade, the demographic groups most similar to Immigrants from Hong Kong are Uruguayan (94.1%, a difference of 0.0%), Immigrants from Somalia (94.1%, a difference of 0.010%), Afghan (94.2%, a difference of 0.060%), Jamaican (94.1%, a difference of 0.060%), and Immigrants from Senegal (94.1%, a difference of 0.060%).
| Demographics | Rating | Rank | 9th Grade |
| Immigrants | Cameroon | 2.1 /100 | #243 | Tragic 94.2% |
| Dutch West Indians | 2.0 /100 | #244 | Tragic 94.2% |
| Paiute | 1.9 /100 | #245 | Tragic 94.2% |
| Senegalese | 1.9 /100 | #246 | Tragic 94.2% |
| Afghans | 1.8 /100 | #247 | Tragic 94.2% |
| Immigrants | Somalia | 1.4 /100 | #248 | Tragic 94.1% |
| Uruguayans | 1.3 /100 | #249 | Tragic 94.1% |
| Immigrants | Hong Kong | 1.3 /100 | #250 | Tragic 94.1% |
| Jamaicans | 1.0 /100 | #251 | Tragic 94.1% |
| Immigrants | Senegal | 0.9 /100 | #252 | Tragic 94.1% |
| Colombians | 0.8 /100 | #253 | Tragic 94.0% |
| U.S. Virgin Islanders | 0.7 /100 | #254 | Tragic 94.0% |
| Immigrants | Nigeria | 0.6 /100 | #255 | Tragic 94.0% |
| Immigrants | Afghanistan | 0.5 /100 | #256 | Tragic 94.0% |
| Immigrants | Costa Rica | 0.5 /100 | #257 | Tragic 94.0% |
Demographics Similar to Ute by 9th Grade
In terms of 9th grade, the demographic groups most similar to Ute are Blackfeet (95.0%, a difference of 0.0%), Pakistani (95.0%, a difference of 0.010%), Venezuelan (95.0%, a difference of 0.010%), Immigrants from Brazil (95.0%, a difference of 0.010%), and Chilean (95.0%, a difference of 0.010%).
| Demographics | Rating | Rank | 9th Grade |
| Immigrants | Ukraine | 67.4 /100 | #159 | Good 95.0% |
| Immigrants | Italy | 66.6 /100 | #160 | Good 95.0% |
| French American Indians | 66.5 /100 | #161 | Good 95.0% |
| Bermudans | 65.8 /100 | #162 | Good 95.0% |
| Pakistanis | 64.1 /100 | #163 | Good 95.0% |
| Venezuelans | 63.6 /100 | #164 | Good 95.0% |
| Blackfeet | 62.6 /100 | #165 | Good 95.0% |
| Ute | 62.6 /100 | #166 | Good 95.0% |
| Immigrants | Brazil | 61.1 /100 | #167 | Good 95.0% |
| Chileans | 60.7 /100 | #168 | Good 95.0% |
| Spaniards | 59.6 /100 | #169 | Average 94.9% |
| Alsatians | 58.6 /100 | #170 | Average 94.9% |
| Colville | 58.5 /100 | #171 | Average 94.9% |
| Iraqis | 54.0 /100 | #172 | Average 94.9% |
| Cheyenne | 51.5 /100 | #173 | Average 94.9% |