Yup'ik vs Ute Receiving Food Stamps
COMPARE
Yup'ik
Ute
Receiving Food Stamps
Receiving Food Stamps Comparison
Yup'ik
Ute
32.7%
RECEIVING FOOD STAMPS
0.0/ 100
METRIC RATING
347th/ 347
METRIC RANK
14.7%
RECEIVING FOOD STAMPS
0.1/ 100
METRIC RATING
275th/ 347
METRIC RANK
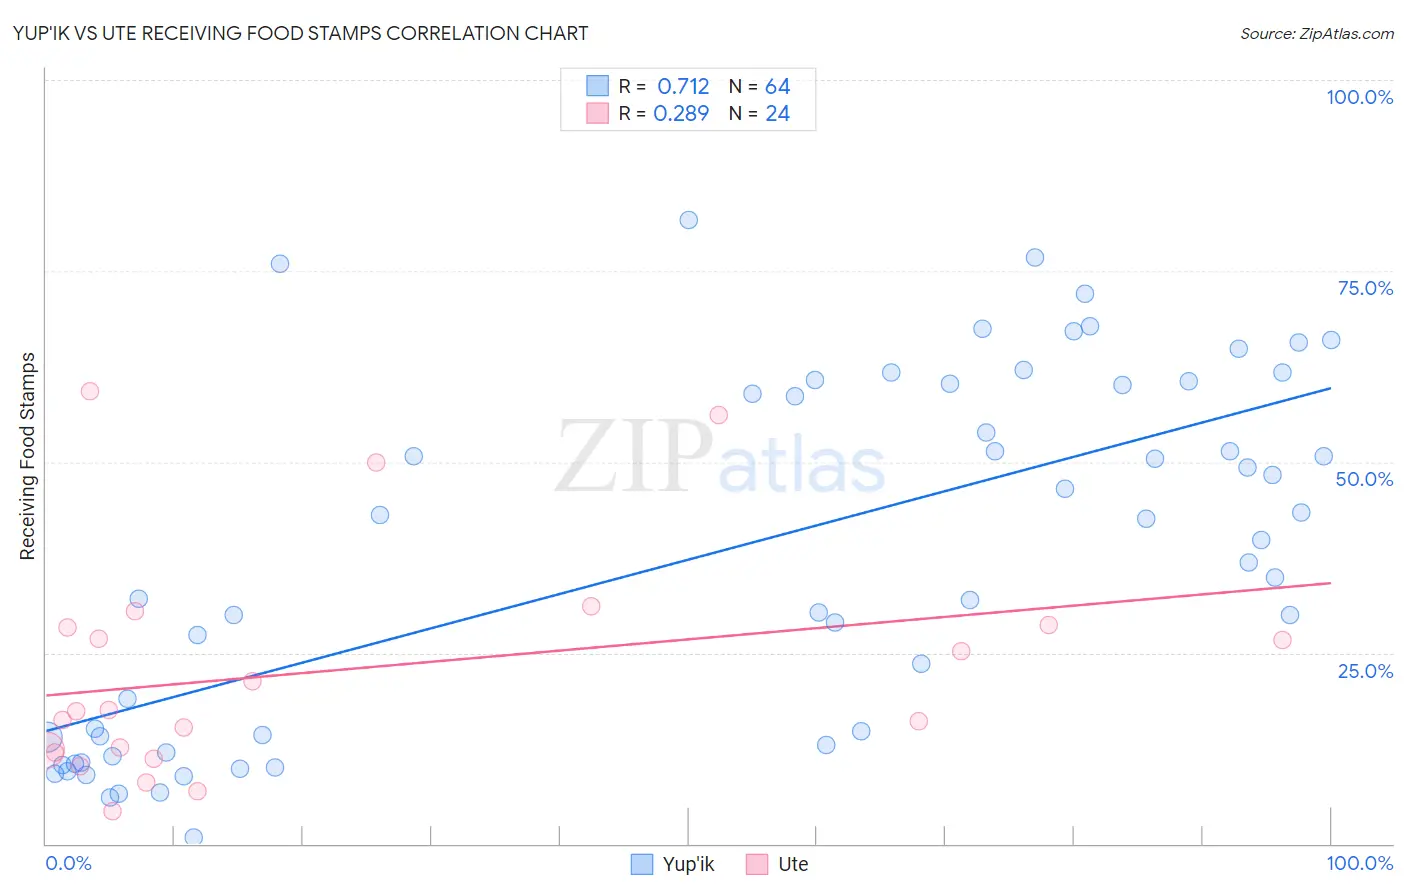
Yup'ik vs Ute Receiving Food Stamps Correlation Chart
The statistical analysis conducted on geographies consisting of 39,947,156 people shows a strong positive correlation between the proportion of Yup'ik and percentage of population receiving government assistance and/or food stamps in the United States with a correlation coefficient (R) of 0.712 and weighted average of 32.7%. Similarly, the statistical analysis conducted on geographies consisting of 55,636,581 people shows a weak positive correlation between the proportion of Ute and percentage of population receiving government assistance and/or food stamps in the United States with a correlation coefficient (R) of 0.289 and weighted average of 14.7%, a difference of 122.3%.
Receiving Food Stamps Correlation Summary
| Measurement | Yup'ik | Ute |
| Minimum | 0.80% | 4.3% |
| Maximum | 81.7% | 59.3% |
| Range | 80.9% | 55.0% |
| Mean | 37.7% | 22.6% |
| Median | 38.3% | 17.4% |
| Interquartile 25% (IQ1) | 13.5% | 12.1% |
| Interquartile 75% (IQ3) | 60.1% | 28.5% |
| Interquartile Range (IQR) | 46.6% | 16.4% |
| Standard Deviation (Sample) | 23.3% | 14.8% |
| Standard Deviation (Population) | 23.2% | 14.5% |
Similar Demographics by Receiving Food Stamps
Demographics Similar to Yup'ik by Receiving Food Stamps
In terms of receiving food stamps, the demographic groups most similar to Yup'ik are Puerto Rican (26.0%, a difference of 25.9%), Immigrants from Cabo Verde (23.8%, a difference of 37.0%), Lumbee (22.9%, a difference of 42.6%), Immigrants from Dominican Republic (22.1%, a difference of 47.7%), and Immigrants from Yemen (21.6%, a difference of 51.0%).
| Demographics | Rating | Rank | Receiving Food Stamps |
| Inupiat | 0.0 /100 | #333 | Tragic 20.1% |
| Yuman | 0.0 /100 | #334 | Tragic 20.2% |
| Immigrants | Cuba | 0.0 /100 | #335 | Tragic 20.8% |
| Navajo | 0.0 /100 | #336 | Tragic 21.1% |
| Cape Verdeans | 0.0 /100 | #337 | Tragic 21.1% |
| Dominicans | 0.0 /100 | #338 | Tragic 21.4% |
| Yakama | 0.0 /100 | #339 | Tragic 21.4% |
| Tohono O'odham | 0.0 /100 | #340 | Tragic 21.5% |
| Hopi | 0.0 /100 | #341 | Tragic 21.6% |
| Immigrants | Yemen | 0.0 /100 | #342 | Tragic 21.6% |
| Immigrants | Dominican Republic | 0.0 /100 | #343 | Tragic 22.1% |
| Lumbee | 0.0 /100 | #344 | Tragic 22.9% |
| Immigrants | Cabo Verde | 0.0 /100 | #345 | Tragic 23.8% |
| Puerto Ricans | 0.0 /100 | #346 | Tragic 26.0% |
| Yup'ik | 0.0 /100 | #347 | Tragic 32.7% |
Demographics Similar to Ute by Receiving Food Stamps
In terms of receiving food stamps, the demographic groups most similar to Ute are Immigrants from Western Africa (14.7%, a difference of 0.080%), Alaskan Athabascan (14.7%, a difference of 0.10%), Chippewa (14.7%, a difference of 0.13%), Immigrants from Guatemala (14.6%, a difference of 0.35%), and Mexican (14.6%, a difference of 0.44%).
| Demographics | Rating | Rank | Receiving Food Stamps |
| Guatemalans | 0.1 /100 | #268 | Tragic 14.4% |
| Nepalese | 0.1 /100 | #269 | Tragic 14.6% |
| Mexicans | 0.1 /100 | #270 | Tragic 14.6% |
| Immigrants | Guatemala | 0.1 /100 | #271 | Tragic 14.6% |
| Chippewa | 0.1 /100 | #272 | Tragic 14.7% |
| Alaskan Athabascans | 0.1 /100 | #273 | Tragic 14.7% |
| Immigrants | Western Africa | 0.1 /100 | #274 | Tragic 14.7% |
| Ute | 0.1 /100 | #275 | Tragic 14.7% |
| Liberians | 0.1 /100 | #276 | Tragic 14.8% |
| Seminole | 0.1 /100 | #277 | Tragic 14.8% |
| Belizeans | 0.1 /100 | #278 | Tragic 14.8% |
| Kiowa | 0.0 /100 | #279 | Tragic 14.9% |
| Ecuadorians | 0.0 /100 | #280 | Tragic 14.9% |
| Spanish American Indians | 0.0 /100 | #281 | Tragic 14.9% |
| Immigrants | Central America | 0.0 /100 | #282 | Tragic 15.0% |