Yup'ik vs Immigrants from Micronesia 9th Grade
COMPARE
Yup'ik
Immigrants from Micronesia
9th Grade
9th Grade Comparison
Yup'ik
Immigrants from Micronesia
95.2%
9TH GRADE
83.3/ 100
METRIC RATING
144th/ 347
METRIC RANK
94.7%
9TH GRADE
24.7/ 100
METRIC RATING
197th/ 347
METRIC RANK
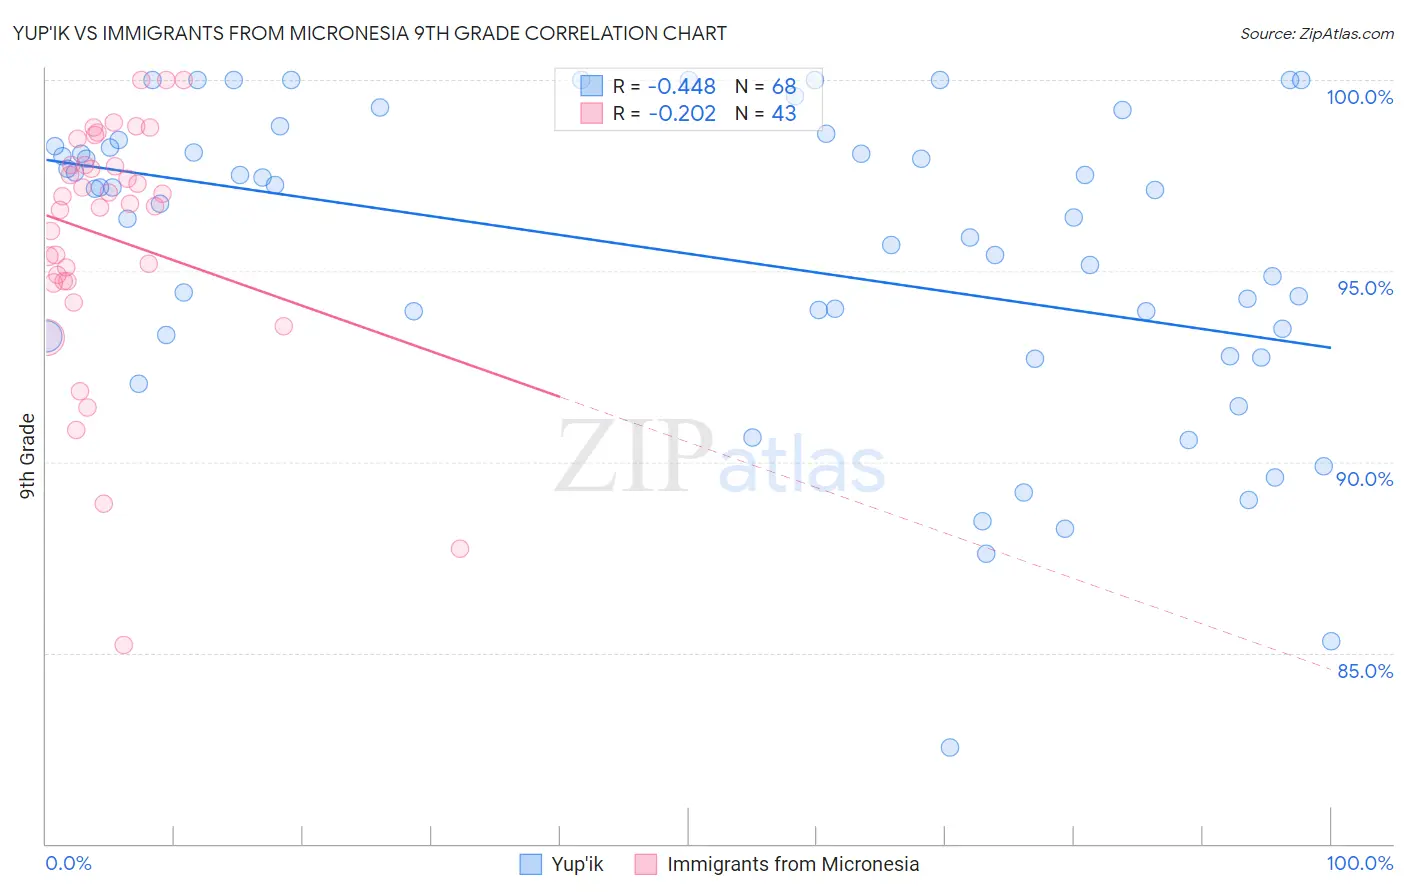
Yup'ik vs Immigrants from Micronesia 9th Grade Correlation Chart
The statistical analysis conducted on geographies consisting of 39,964,654 people shows a moderate negative correlation between the proportion of Yup'ik and percentage of population with at least 9th grade education in the United States with a correlation coefficient (R) of -0.448 and weighted average of 95.2%. Similarly, the statistical analysis conducted on geographies consisting of 61,604,657 people shows a weak negative correlation between the proportion of Immigrants from Micronesia and percentage of population with at least 9th grade education in the United States with a correlation coefficient (R) of -0.202 and weighted average of 94.7%, a difference of 0.50%.
9th Grade Correlation Summary
| Measurement | Yup'ik | Immigrants from Micronesia |
| Minimum | 82.5% | 85.2% |
| Maximum | 100.0% | 100.0% |
| Range | 17.5% | 14.8% |
| Mean | 95.4% | 95.9% |
| Median | 96.9% | 96.8% |
| Interquartile 25% (IQ1) | 93.3% | 94.7% |
| Interquartile 75% (IQ3) | 98.3% | 97.8% |
| Interquartile Range (IQR) | 5.0% | 3.0% |
| Standard Deviation (Sample) | 4.0% | 3.3% |
| Standard Deviation (Population) | 4.0% | 3.2% |
Similar Demographics by 9th Grade
Demographics Similar to Yup'ik by 9th Grade
In terms of 9th grade, the demographic groups most similar to Yup'ik are Spanish (95.2%, a difference of 0.010%), Immigrants from Greece (95.2%, a difference of 0.020%), Pueblo (95.1%, a difference of 0.020%), Immigrants from Sri Lanka (95.1%, a difference of 0.020%), and Choctaw (95.1%, a difference of 0.020%).
| Demographics | Rating | Rank | 9th Grade |
| Hmong | 87.7 /100 | #137 | Excellent 95.2% |
| Immigrants | Russia | 86.6 /100 | #138 | Excellent 95.2% |
| Immigrants | Eastern Europe | 85.8 /100 | #139 | Excellent 95.2% |
| Immigrants | Taiwan | 85.3 /100 | #140 | Excellent 95.2% |
| Immigrants | Bosnia and Herzegovina | 85.2 /100 | #141 | Excellent 95.2% |
| Immigrants | Greece | 84.6 /100 | #142 | Excellent 95.2% |
| Spanish | 84.4 /100 | #143 | Excellent 95.2% |
| Yup'ik | 83.3 /100 | #144 | Excellent 95.2% |
| Pueblo | 82.2 /100 | #145 | Excellent 95.1% |
| Immigrants | Sri Lanka | 82.1 /100 | #146 | Excellent 95.1% |
| Choctaw | 81.9 /100 | #147 | Excellent 95.1% |
| Immigrants | Jordan | 81.2 /100 | #148 | Excellent 95.1% |
| Immigrants | Korea | 79.6 /100 | #149 | Good 95.1% |
| Kenyans | 79.1 /100 | #150 | Good 95.1% |
| Cajuns | 77.3 /100 | #151 | Good 95.1% |
Demographics Similar to Immigrants from Micronesia by 9th Grade
In terms of 9th grade, the demographic groups most similar to Immigrants from Micronesia are Immigrants from Lebanon (94.7%, a difference of 0.020%), Hawaiian (94.7%, a difference of 0.020%), Marshallese (94.7%, a difference of 0.030%), Panamanian (94.7%, a difference of 0.040%), and Laotian (94.6%, a difference of 0.040%).
| Demographics | Rating | Rank | 9th Grade |
| Sudanese | 32.7 /100 | #190 | Fair 94.7% |
| Assyrians/Chaldeans/Syriacs | 32.0 /100 | #191 | Fair 94.7% |
| Immigrants | Northern Africa | 30.7 /100 | #192 | Fair 94.7% |
| Paraguayans | 30.1 /100 | #193 | Fair 94.7% |
| Panamanians | 29.0 /100 | #194 | Fair 94.7% |
| Marshallese | 27.9 /100 | #195 | Fair 94.7% |
| Immigrants | Lebanon | 27.2 /100 | #196 | Fair 94.7% |
| Immigrants | Micronesia | 24.7 /100 | #197 | Fair 94.7% |
| Hawaiians | 22.7 /100 | #198 | Fair 94.7% |
| Laotians | 21.0 /100 | #199 | Fair 94.6% |
| Immigrants | Zaire | 20.6 /100 | #200 | Fair 94.6% |
| Blacks/African Americans | 20.5 /100 | #201 | Fair 94.6% |
| Immigrants | Eastern Asia | 19.8 /100 | #202 | Poor 94.6% |
| Immigrants | Bahamas | 19.8 /100 | #203 | Poor 94.6% |
| Moroccans | 19.6 /100 | #204 | Poor 94.6% |