Dominican vs Ute 9th Grade
COMPARE
Dominican
Ute
9th Grade
9th Grade Comparison
Dominicans
Ute
91.1%
9TH GRADE
0.0/ 100
METRIC RATING
328th/ 347
METRIC RANK
95.0%
9TH GRADE
62.6/ 100
METRIC RATING
166th/ 347
METRIC RANK
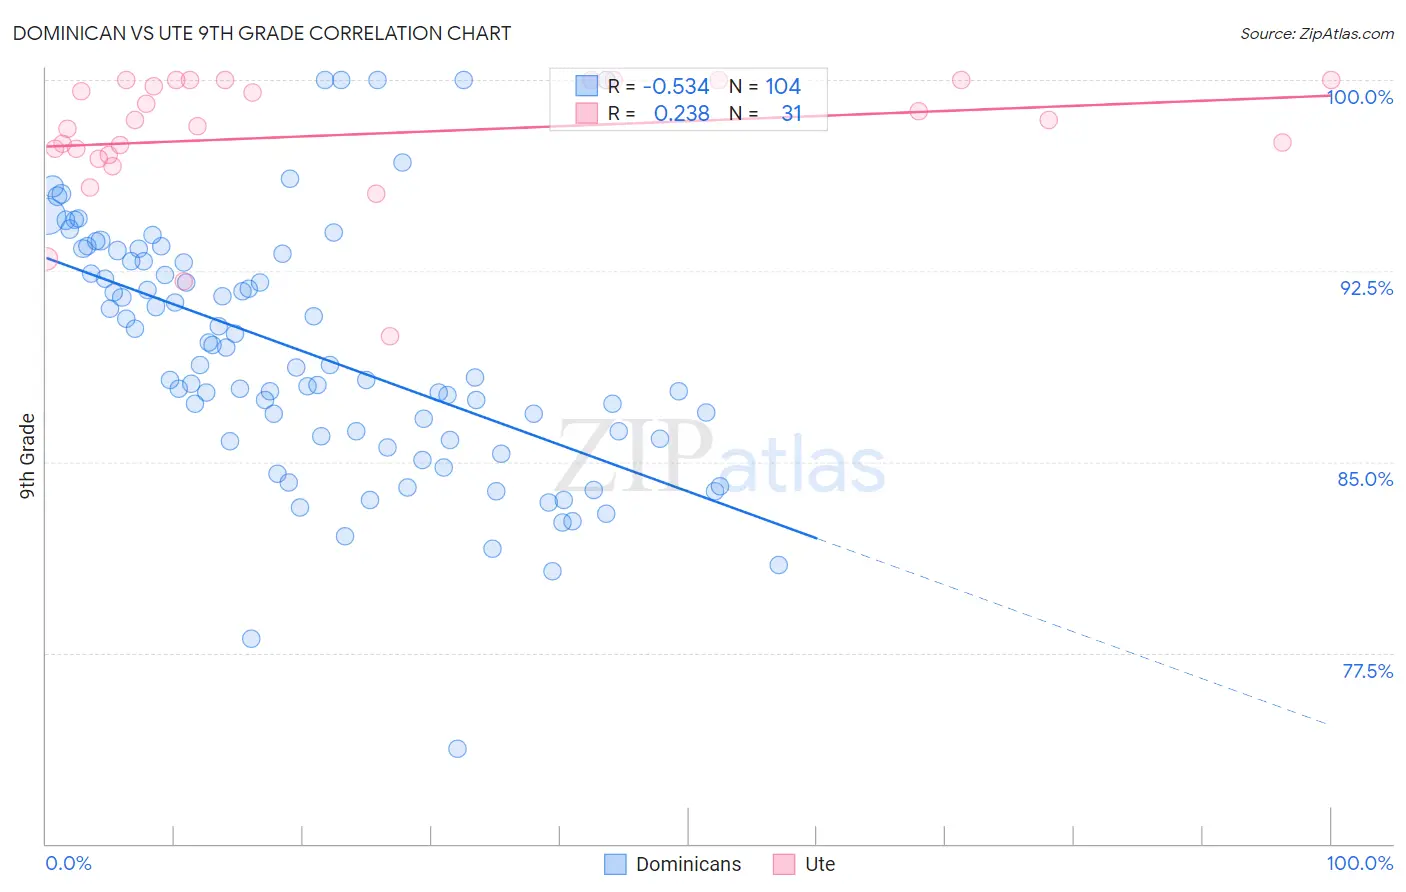
Dominican vs Ute 9th Grade Correlation Chart
The statistical analysis conducted on geographies consisting of 355,142,452 people shows a substantial negative correlation between the proportion of Dominicans and percentage of population with at least 9th grade education in the United States with a correlation coefficient (R) of -0.534 and weighted average of 91.1%. Similarly, the statistical analysis conducted on geographies consisting of 55,668,539 people shows a weak positive correlation between the proportion of Ute and percentage of population with at least 9th grade education in the United States with a correlation coefficient (R) of 0.238 and weighted average of 95.0%, a difference of 4.3%.
9th Grade Correlation Summary
| Measurement | Dominican | Ute |
| Minimum | 73.7% | 89.9% |
| Maximum | 100.0% | 100.0% |
| Range | 26.3% | 10.1% |
| Mean | 89.2% | 97.9% |
| Median | 88.7% | 98.4% |
| Interquartile 25% (IQ1) | 85.9% | 97.0% |
| Interquartile 75% (IQ3) | 92.9% | 100.0% |
| Interquartile Range (IQR) | 7.0% | 3.0% |
| Standard Deviation (Sample) | 4.9% | 2.5% |
| Standard Deviation (Population) | 4.9% | 2.5% |
Similar Demographics by 9th Grade
Demographics Similar to Dominicans by 9th Grade
In terms of 9th grade, the demographic groups most similar to Dominicans are Honduran (91.0%, a difference of 0.030%), Immigrants from Cabo Verde (90.9%, a difference of 0.15%), Mexican American Indian (90.9%, a difference of 0.18%), Hispanic or Latino (90.9%, a difference of 0.20%), and Immigrants from Yemen (90.8%, a difference of 0.29%).
| Demographics | Rating | Rank | 9th Grade |
| Immigrants | Ecuador | 0.0 /100 | #321 | Tragic 91.8% |
| Belizeans | 0.0 /100 | #322 | Tragic 91.8% |
| Puerto Ricans | 0.0 /100 | #323 | Tragic 91.8% |
| Immigrants | Belize | 0.0 /100 | #324 | Tragic 91.8% |
| Central American Indians | 0.0 /100 | #325 | Tragic 91.5% |
| Immigrants | Armenia | 0.0 /100 | #326 | Tragic 91.4% |
| Immigrants | Nicaragua | 0.0 /100 | #327 | Tragic 91.3% |
| Dominicans | 0.0 /100 | #328 | Tragic 91.1% |
| Hondurans | 0.0 /100 | #329 | Tragic 91.0% |
| Immigrants | Cabo Verde | 0.0 /100 | #330 | Tragic 90.9% |
| Mexican American Indians | 0.0 /100 | #331 | Tragic 90.9% |
| Hispanics or Latinos | 0.0 /100 | #332 | Tragic 90.9% |
| Immigrants | Yemen | 0.0 /100 | #333 | Tragic 90.8% |
| Immigrants | Azores | 0.0 /100 | #334 | Tragic 90.8% |
| Immigrants | Honduras | 0.0 /100 | #335 | Tragic 90.6% |
Demographics Similar to Ute by 9th Grade
In terms of 9th grade, the demographic groups most similar to Ute are Blackfeet (95.0%, a difference of 0.0%), Pakistani (95.0%, a difference of 0.010%), Venezuelan (95.0%, a difference of 0.010%), Immigrants from Brazil (95.0%, a difference of 0.010%), and Chilean (95.0%, a difference of 0.010%).
| Demographics | Rating | Rank | 9th Grade |
| Immigrants | Ukraine | 67.4 /100 | #159 | Good 95.0% |
| Immigrants | Italy | 66.6 /100 | #160 | Good 95.0% |
| French American Indians | 66.5 /100 | #161 | Good 95.0% |
| Bermudans | 65.8 /100 | #162 | Good 95.0% |
| Pakistanis | 64.1 /100 | #163 | Good 95.0% |
| Venezuelans | 63.6 /100 | #164 | Good 95.0% |
| Blackfeet | 62.6 /100 | #165 | Good 95.0% |
| Ute | 62.6 /100 | #166 | Good 95.0% |
| Immigrants | Brazil | 61.1 /100 | #167 | Good 95.0% |
| Chileans | 60.7 /100 | #168 | Good 95.0% |
| Spaniards | 59.6 /100 | #169 | Average 94.9% |
| Alsatians | 58.6 /100 | #170 | Average 94.9% |
| Colville | 58.5 /100 | #171 | Average 94.9% |
| Iraqis | 54.0 /100 | #172 | Average 94.9% |
| Cheyenne | 51.5 /100 | #173 | Average 94.9% |