Yuman vs Macedonian College, Under 1 year
COMPARE
Yuman
Macedonian
College, Under 1 year
College, Under 1 year Comparison
Yuman
Macedonians
55.1%
COLLEGE, UNDER 1 YEAR
0.0/ 100
METRIC RATING
333rd/ 347
METRIC RANK
67.6%
COLLEGE, UNDER 1 YEAR
95.7/ 100
METRIC RATING
112th/ 347
METRIC RANK
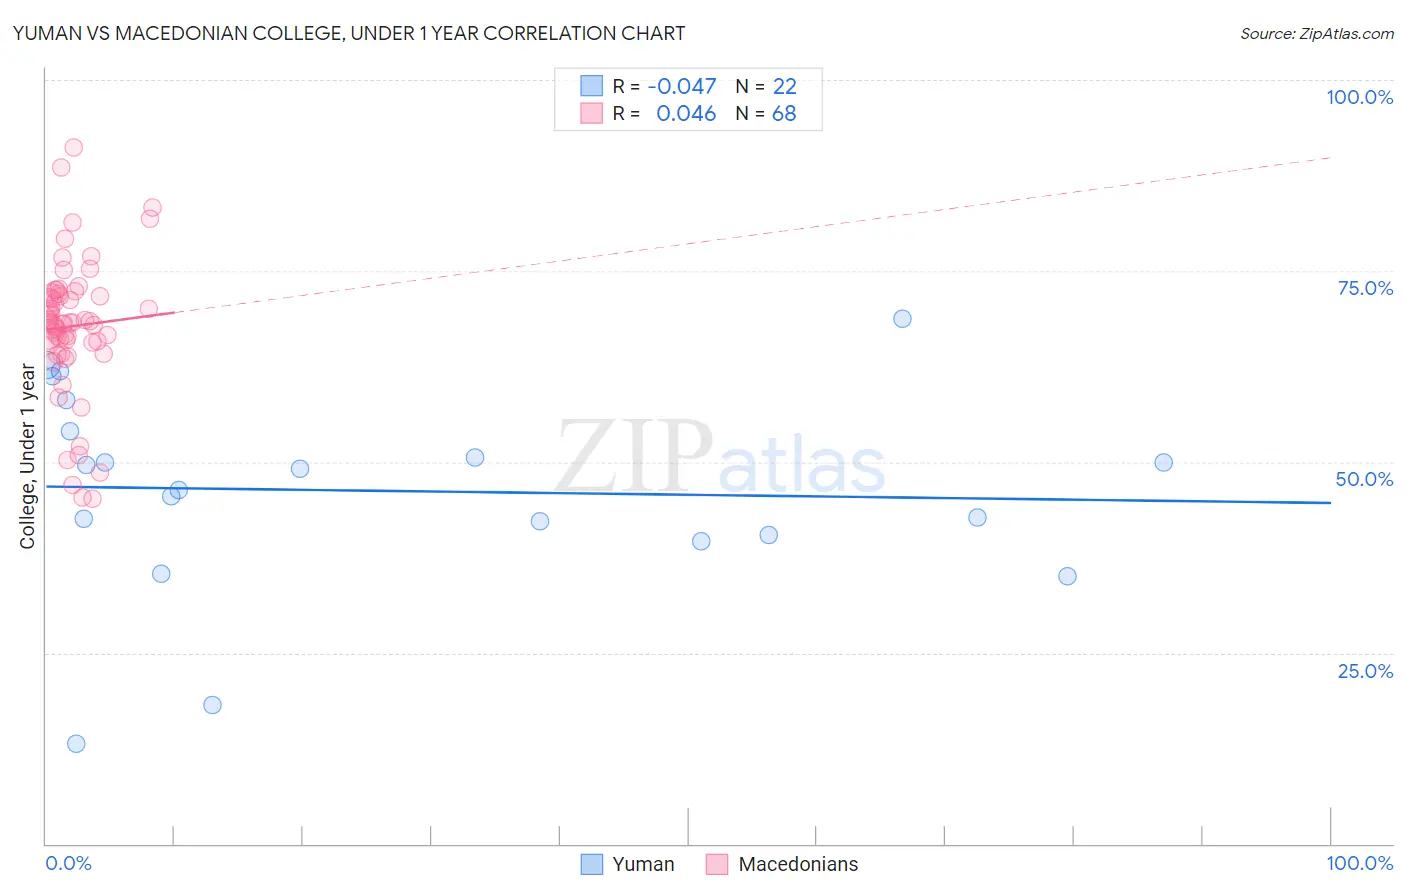
Yuman vs Macedonian College, Under 1 year Correlation Chart
The statistical analysis conducted on geographies consisting of 40,696,202 people shows no correlation between the proportion of Yuman and percentage of population with at least college, under 1 year education in the United States with a correlation coefficient (R) of -0.047 and weighted average of 55.1%. Similarly, the statistical analysis conducted on geographies consisting of 132,646,607 people shows no correlation between the proportion of Macedonians and percentage of population with at least college, under 1 year education in the United States with a correlation coefficient (R) of 0.046 and weighted average of 67.6%, a difference of 22.8%.
College, Under 1 year Correlation Summary
| Measurement | Yuman | Macedonian |
| Minimum | 13.1% | 45.2% |
| Maximum | 68.8% | 91.1% |
| Range | 55.7% | 45.9% |
| Mean | 46.2% | 67.7% |
| Median | 47.7% | 68.1% |
| Interquartile 25% (IQ1) | 40.4% | 65.6% |
| Interquartile 75% (IQ3) | 54.0% | 71.8% |
| Interquartile Range (IQR) | 13.5% | 6.2% |
| Standard Deviation (Sample) | 13.4% | 8.9% |
| Standard Deviation (Population) | 13.1% | 8.8% |
Similar Demographics by College, Under 1 year
Demographics Similar to Yuman by College, Under 1 year
In terms of college, under 1 year, the demographic groups most similar to Yuman are Immigrants from Yemen (55.3%, a difference of 0.32%), Immigrants from the Azores (54.7%, a difference of 0.72%), Dominican (55.5%, a difference of 0.73%), Inupiat (54.6%, a difference of 0.85%), and Mexican (55.6%, a difference of 0.99%).
| Demographics | Rating | Rank | College, Under 1 year |
| Navajo | 0.0 /100 | #326 | Tragic 56.3% |
| Immigrants | Guatemala | 0.0 /100 | #327 | Tragic 56.2% |
| Cape Verdeans | 0.0 /100 | #328 | Tragic 56.0% |
| Immigrants | Cuba | 0.0 /100 | #329 | Tragic 55.7% |
| Mexicans | 0.0 /100 | #330 | Tragic 55.6% |
| Dominicans | 0.0 /100 | #331 | Tragic 55.5% |
| Immigrants | Yemen | 0.0 /100 | #332 | Tragic 55.3% |
| Yuman | 0.0 /100 | #333 | Tragic 55.1% |
| Immigrants | Azores | 0.0 /100 | #334 | Tragic 54.7% |
| Inupiat | 0.0 /100 | #335 | Tragic 54.6% |
| Pennsylvania Germans | 0.0 /100 | #336 | Tragic 54.5% |
| Immigrants | Central America | 0.0 /100 | #337 | Tragic 54.4% |
| Lumbee | 0.0 /100 | #338 | Tragic 54.2% |
| Immigrants | Dominican Republic | 0.0 /100 | #339 | Tragic 54.0% |
| Spanish American Indians | 0.0 /100 | #340 | Tragic 54.0% |
Demographics Similar to Macedonians by College, Under 1 year
In terms of college, under 1 year, the demographic groups most similar to Macedonians are Scandinavian (67.7%, a difference of 0.020%), Assyrian/Chaldean/Syriac (67.7%, a difference of 0.020%), Ukrainian (67.7%, a difference of 0.020%), Syrian (67.6%, a difference of 0.030%), and Immigrants from Egypt (67.7%, a difference of 0.080%).
| Demographics | Rating | Rank | College, Under 1 year |
| Afghans | 96.6 /100 | #105 | Exceptional 67.8% |
| Immigrants | Croatia | 96.6 /100 | #106 | Exceptional 67.8% |
| Austrians | 96.4 /100 | #107 | Exceptional 67.8% |
| Immigrants | Egypt | 96.0 /100 | #108 | Exceptional 67.7% |
| Scandinavians | 95.8 /100 | #109 | Exceptional 67.7% |
| Assyrians/Chaldeans/Syriacs | 95.8 /100 | #110 | Exceptional 67.7% |
| Ukrainians | 95.8 /100 | #111 | Exceptional 67.7% |
| Macedonians | 95.7 /100 | #112 | Exceptional 67.6% |
| Syrians | 95.6 /100 | #113 | Exceptional 67.6% |
| Chileans | 95.3 /100 | #114 | Exceptional 67.6% |
| Basques | 95.2 /100 | #115 | Exceptional 67.6% |
| Immigrants | Nepal | 94.9 /100 | #116 | Exceptional 67.5% |
| Pakistanis | 94.8 /100 | #117 | Exceptional 67.5% |
| Immigrants | Ukraine | 94.7 /100 | #118 | Exceptional 67.5% |
| Lebanese | 94.6 /100 | #119 | Exceptional 67.5% |