Yuman vs Northern European College, Under 1 year
COMPARE
Yuman
Northern European
College, Under 1 year
College, Under 1 year Comparison
Yuman
Northern Europeans
55.1%
COLLEGE, UNDER 1 YEAR
0.0/ 100
METRIC RATING
333rd/ 347
METRIC RANK
69.0%
COLLEGE, UNDER 1 YEAR
99.4/ 100
METRIC RATING
64th/ 347
METRIC RANK
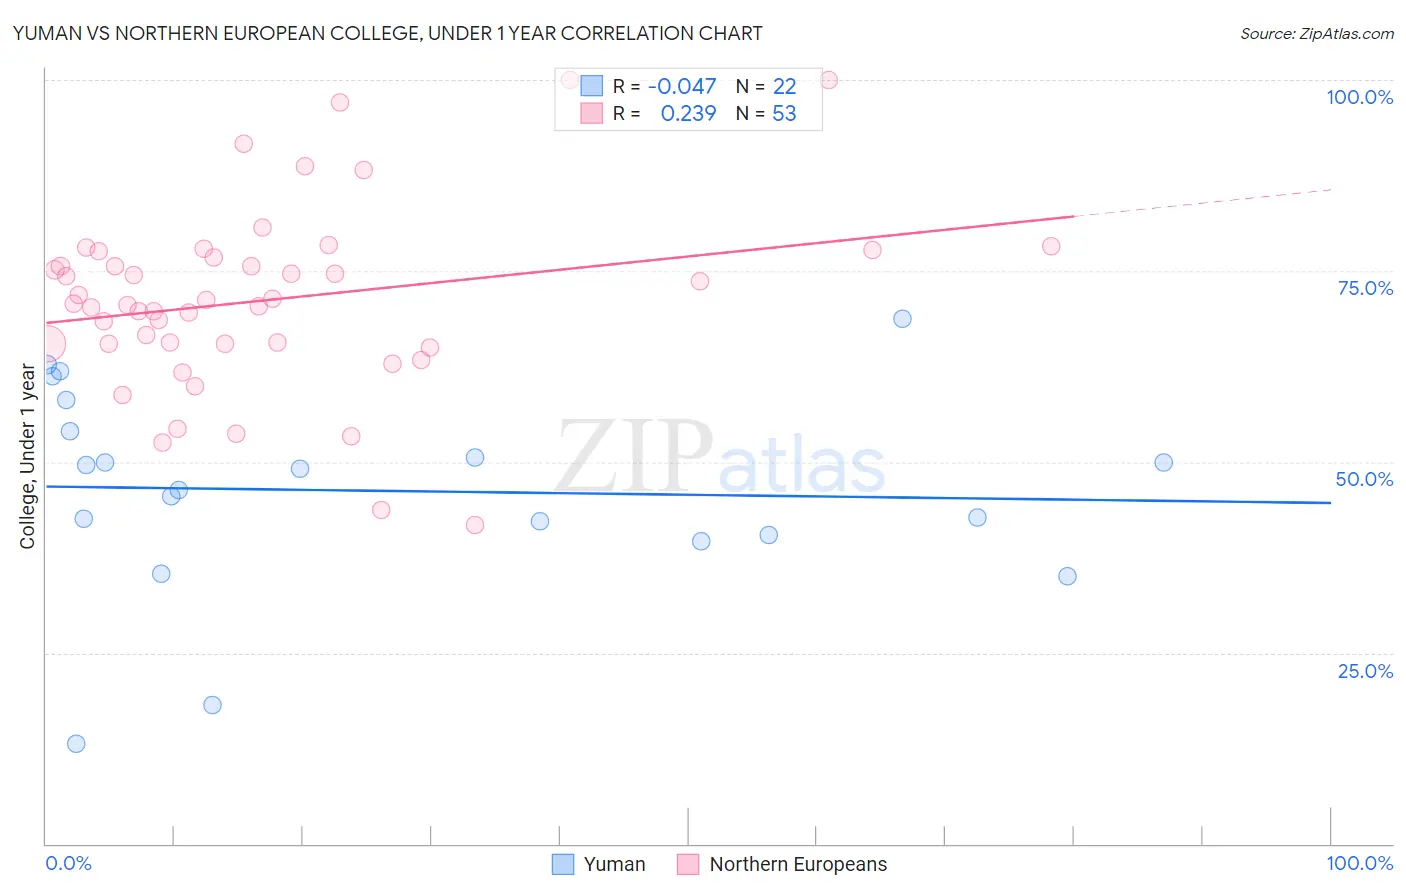
Yuman vs Northern European College, Under 1 year Correlation Chart
The statistical analysis conducted on geographies consisting of 40,696,202 people shows no correlation between the proportion of Yuman and percentage of population with at least college, under 1 year education in the United States with a correlation coefficient (R) of -0.047 and weighted average of 55.1%. Similarly, the statistical analysis conducted on geographies consisting of 406,096,233 people shows a weak positive correlation between the proportion of Northern Europeans and percentage of population with at least college, under 1 year education in the United States with a correlation coefficient (R) of 0.239 and weighted average of 69.0%, a difference of 25.4%.
College, Under 1 year Correlation Summary
| Measurement | Yuman | Northern European |
| Minimum | 13.1% | 41.7% |
| Maximum | 68.8% | 100.0% |
| Range | 55.7% | 58.3% |
| Mean | 46.2% | 71.2% |
| Median | 47.7% | 70.7% |
| Interquartile 25% (IQ1) | 40.4% | 65.5% |
| Interquartile 75% (IQ3) | 54.0% | 77.2% |
| Interquartile Range (IQR) | 13.5% | 11.7% |
| Standard Deviation (Sample) | 13.4% | 12.0% |
| Standard Deviation (Population) | 13.1% | 11.9% |
Similar Demographics by College, Under 1 year
Demographics Similar to Yuman by College, Under 1 year
In terms of college, under 1 year, the demographic groups most similar to Yuman are Immigrants from Yemen (55.3%, a difference of 0.32%), Immigrants from the Azores (54.7%, a difference of 0.72%), Dominican (55.5%, a difference of 0.73%), Inupiat (54.6%, a difference of 0.85%), and Mexican (55.6%, a difference of 0.99%).
| Demographics | Rating | Rank | College, Under 1 year |
| Navajo | 0.0 /100 | #326 | Tragic 56.3% |
| Immigrants | Guatemala | 0.0 /100 | #327 | Tragic 56.2% |
| Cape Verdeans | 0.0 /100 | #328 | Tragic 56.0% |
| Immigrants | Cuba | 0.0 /100 | #329 | Tragic 55.7% |
| Mexicans | 0.0 /100 | #330 | Tragic 55.6% |
| Dominicans | 0.0 /100 | #331 | Tragic 55.5% |
| Immigrants | Yemen | 0.0 /100 | #332 | Tragic 55.3% |
| Yuman | 0.0 /100 | #333 | Tragic 55.1% |
| Immigrants | Azores | 0.0 /100 | #334 | Tragic 54.7% |
| Inupiat | 0.0 /100 | #335 | Tragic 54.6% |
| Pennsylvania Germans | 0.0 /100 | #336 | Tragic 54.5% |
| Immigrants | Central America | 0.0 /100 | #337 | Tragic 54.4% |
| Lumbee | 0.0 /100 | #338 | Tragic 54.2% |
| Immigrants | Dominican Republic | 0.0 /100 | #339 | Tragic 54.0% |
| Spanish American Indians | 0.0 /100 | #340 | Tragic 54.0% |
Demographics Similar to Northern Europeans by College, Under 1 year
In terms of college, under 1 year, the demographic groups most similar to Northern Europeans are Immigrants from Moldova (69.0%, a difference of 0.020%), Immigrants from Canada (69.1%, a difference of 0.040%), Immigrants from North America (69.0%, a difference of 0.040%), Immigrants from Kazakhstan (69.2%, a difference of 0.17%), and Immigrants from Belarus (69.2%, a difference of 0.17%).
| Demographics | Rating | Rank | College, Under 1 year |
| Asians | 99.6 /100 | #57 | Exceptional 69.4% |
| Immigrants | Malaysia | 99.6 /100 | #58 | Exceptional 69.3% |
| Immigrants | Serbia | 99.5 /100 | #59 | Exceptional 69.3% |
| Immigrants | Asia | 99.5 /100 | #60 | Exceptional 69.2% |
| Immigrants | Kazakhstan | 99.5 /100 | #61 | Exceptional 69.2% |
| Immigrants | Belarus | 99.5 /100 | #62 | Exceptional 69.2% |
| Immigrants | Canada | 99.4 /100 | #63 | Exceptional 69.1% |
| Northern Europeans | 99.4 /100 | #64 | Exceptional 69.0% |
| Immigrants | Moldova | 99.3 /100 | #65 | Exceptional 69.0% |
| Immigrants | North America | 99.3 /100 | #66 | Exceptional 69.0% |
| Immigrants | Zimbabwe | 99.2 /100 | #67 | Exceptional 68.9% |
| Immigrants | Indonesia | 99.2 /100 | #68 | Exceptional 68.9% |
| Immigrants | Romania | 99.2 /100 | #69 | Exceptional 68.9% |
| Lithuanians | 99.1 /100 | #70 | Exceptional 68.8% |
| Immigrants | Europe | 99.1 /100 | #71 | Exceptional 68.8% |