Yuman vs Immigrants from Uruguay College, Under 1 year
COMPARE
Yuman
Immigrants from Uruguay
College, Under 1 year
College, Under 1 year Comparison
Yuman
Immigrants from Uruguay
55.1%
COLLEGE, UNDER 1 YEAR
0.0/ 100
METRIC RATING
333rd/ 347
METRIC RANK
63.4%
COLLEGE, UNDER 1 YEAR
5.8/ 100
METRIC RATING
217th/ 347
METRIC RANK
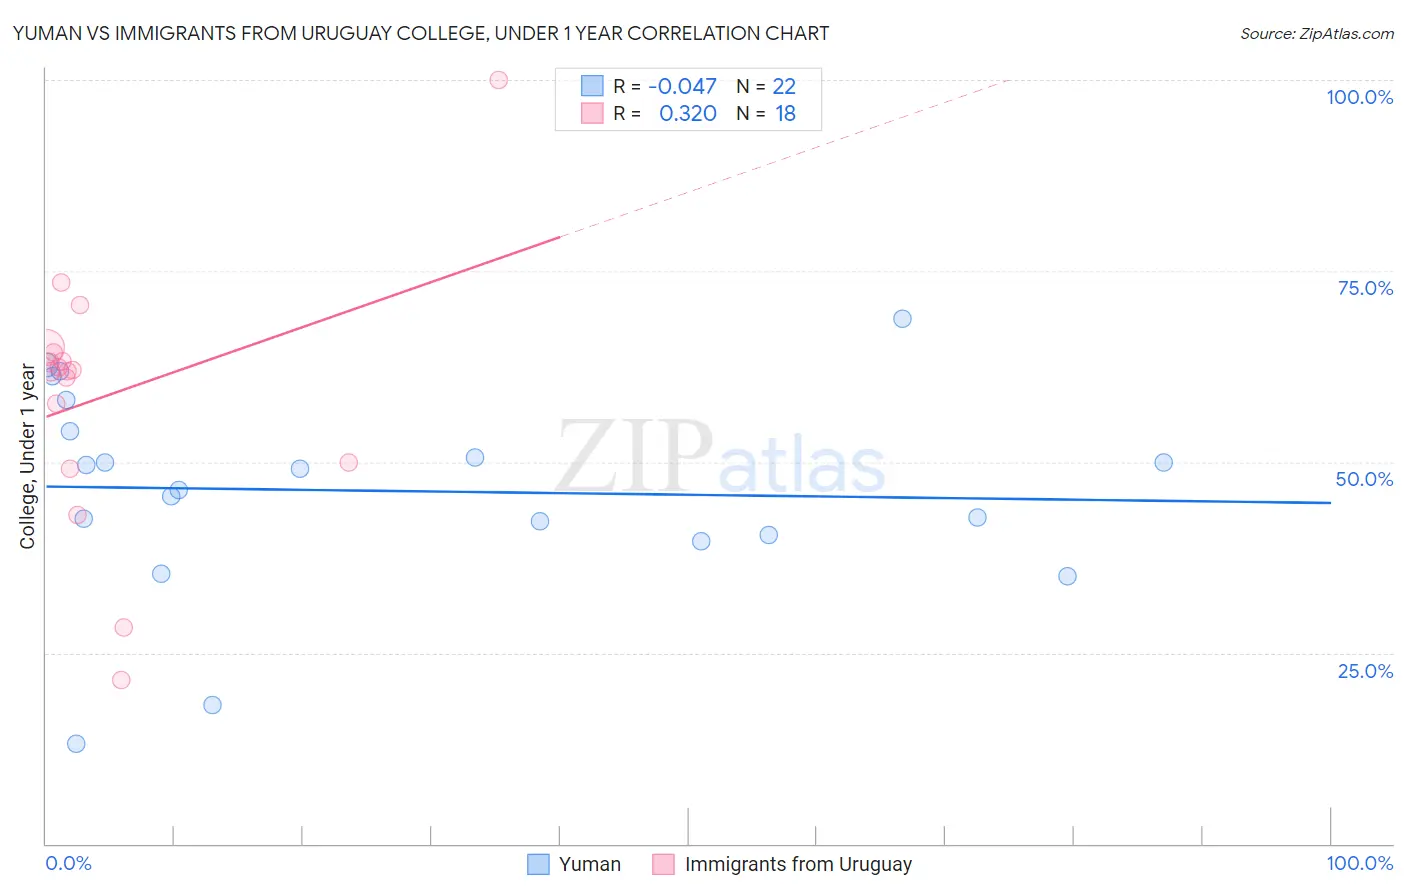
Yuman vs Immigrants from Uruguay College, Under 1 year Correlation Chart
The statistical analysis conducted on geographies consisting of 40,696,202 people shows no correlation between the proportion of Yuman and percentage of population with at least college, under 1 year education in the United States with a correlation coefficient (R) of -0.047 and weighted average of 55.1%. Similarly, the statistical analysis conducted on geographies consisting of 133,259,667 people shows a mild positive correlation between the proportion of Immigrants from Uruguay and percentage of population with at least college, under 1 year education in the United States with a correlation coefficient (R) of 0.320 and weighted average of 63.4%, a difference of 15.1%.
College, Under 1 year Correlation Summary
| Measurement | Yuman | Immigrants from Uruguay |
| Minimum | 13.1% | 21.5% |
| Maximum | 68.8% | 100.0% |
| Range | 55.7% | 78.5% |
| Mean | 46.2% | 58.8% |
| Median | 47.7% | 62.0% |
| Interquartile 25% (IQ1) | 40.4% | 50.0% |
| Interquartile 75% (IQ3) | 54.0% | 64.4% |
| Interquartile Range (IQR) | 13.5% | 14.4% |
| Standard Deviation (Sample) | 13.4% | 17.1% |
| Standard Deviation (Population) | 13.1% | 16.6% |
Similar Demographics by College, Under 1 year
Demographics Similar to Yuman by College, Under 1 year
In terms of college, under 1 year, the demographic groups most similar to Yuman are Immigrants from Yemen (55.3%, a difference of 0.32%), Immigrants from the Azores (54.7%, a difference of 0.72%), Dominican (55.5%, a difference of 0.73%), Inupiat (54.6%, a difference of 0.85%), and Mexican (55.6%, a difference of 0.99%).
| Demographics | Rating | Rank | College, Under 1 year |
| Navajo | 0.0 /100 | #326 | Tragic 56.3% |
| Immigrants | Guatemala | 0.0 /100 | #327 | Tragic 56.2% |
| Cape Verdeans | 0.0 /100 | #328 | Tragic 56.0% |
| Immigrants | Cuba | 0.0 /100 | #329 | Tragic 55.7% |
| Mexicans | 0.0 /100 | #330 | Tragic 55.6% |
| Dominicans | 0.0 /100 | #331 | Tragic 55.5% |
| Immigrants | Yemen | 0.0 /100 | #332 | Tragic 55.3% |
| Yuman | 0.0 /100 | #333 | Tragic 55.1% |
| Immigrants | Azores | 0.0 /100 | #334 | Tragic 54.7% |
| Inupiat | 0.0 /100 | #335 | Tragic 54.6% |
| Pennsylvania Germans | 0.0 /100 | #336 | Tragic 54.5% |
| Immigrants | Central America | 0.0 /100 | #337 | Tragic 54.4% |
| Lumbee | 0.0 /100 | #338 | Tragic 54.2% |
| Immigrants | Dominican Republic | 0.0 /100 | #339 | Tragic 54.0% |
| Spanish American Indians | 0.0 /100 | #340 | Tragic 54.0% |
Demographics Similar to Immigrants from Uruguay by College, Under 1 year
In terms of college, under 1 year, the demographic groups most similar to Immigrants from Uruguay are Immigrants from Panama (63.4%, a difference of 0.020%), Immigrants from Fiji (63.4%, a difference of 0.030%), Portuguese (63.4%, a difference of 0.050%), Cree (63.3%, a difference of 0.14%), and Hmong (63.5%, a difference of 0.19%).
| Demographics | Rating | Rank | College, Under 1 year |
| Ghanaians | 11.2 /100 | #210 | Poor 63.9% |
| Native Hawaiians | 10.6 /100 | #211 | Poor 63.9% |
| Immigrants | Middle Africa | 10.5 /100 | #212 | Poor 63.9% |
| Immigrants | South America | 9.1 /100 | #213 | Tragic 63.8% |
| Immigrants | Nigeria | 8.8 /100 | #214 | Tragic 63.7% |
| Senegalese | 7.7 /100 | #215 | Tragic 63.6% |
| Hmong | 6.8 /100 | #216 | Tragic 63.5% |
| Immigrants | Uruguay | 5.8 /100 | #217 | Tragic 63.4% |
| Immigrants | Panama | 5.7 /100 | #218 | Tragic 63.4% |
| Immigrants | Fiji | 5.7 /100 | #219 | Tragic 63.4% |
| Portuguese | 5.6 /100 | #220 | Tragic 63.4% |
| Cree | 5.2 /100 | #221 | Tragic 63.3% |
| Immigrants | Senegal | 5.0 /100 | #222 | Tragic 63.3% |
| Immigrants | Costa Rica | 4.5 /100 | #223 | Tragic 63.2% |
| Sub-Saharan Africans | 4.4 /100 | #224 | Tragic 63.2% |