Senegalese vs Macedonian College, Under 1 year
COMPARE
Senegalese
Macedonian
College, Under 1 year
College, Under 1 year Comparison
Senegalese
Macedonians
63.6%
COLLEGE, UNDER 1 YEAR
7.7/ 100
METRIC RATING
215th/ 347
METRIC RANK
67.6%
COLLEGE, UNDER 1 YEAR
95.7/ 100
METRIC RATING
112th/ 347
METRIC RANK
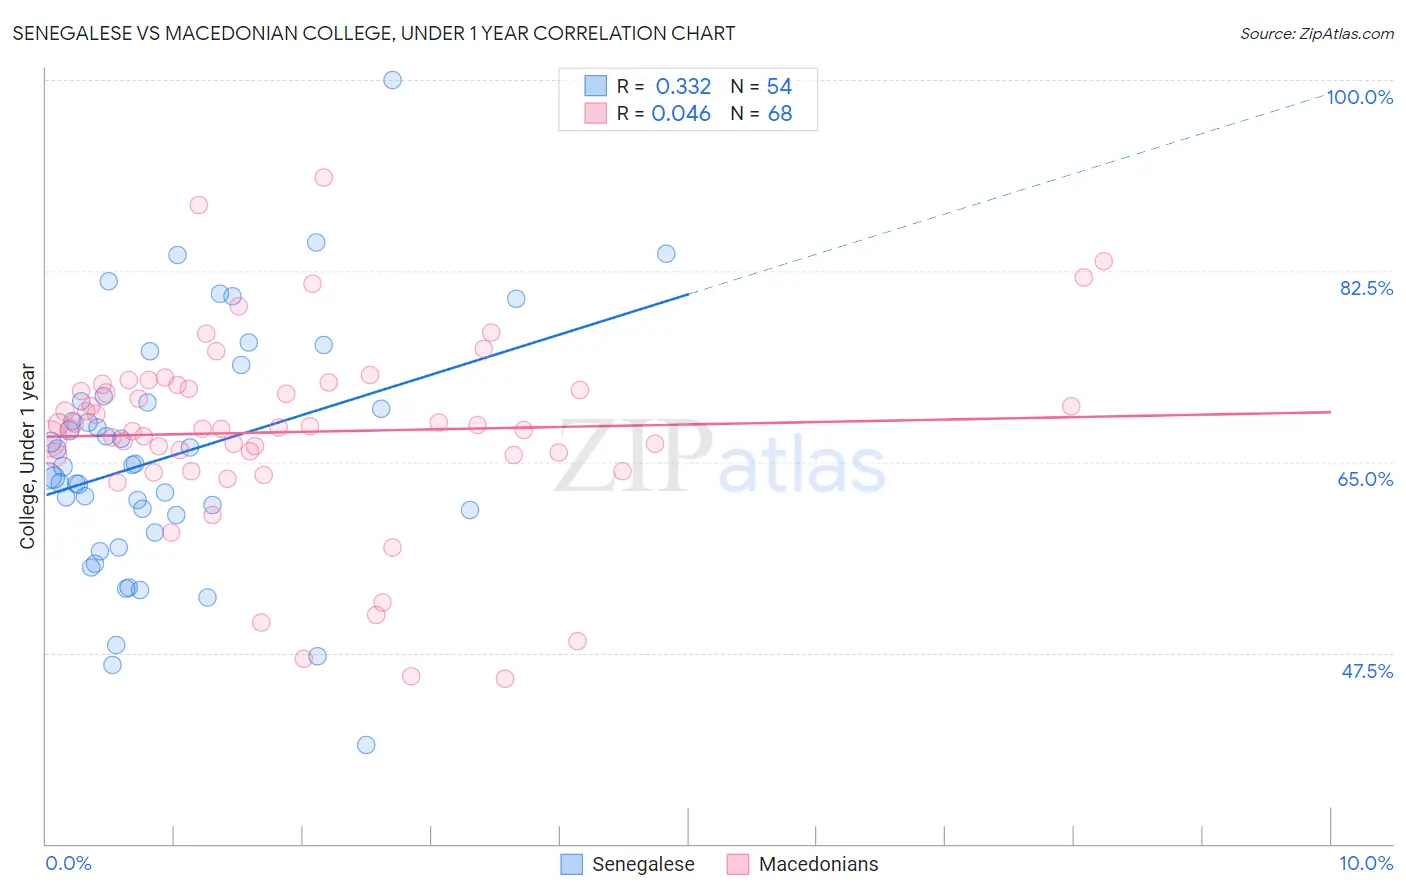
Senegalese vs Macedonian College, Under 1 year Correlation Chart
The statistical analysis conducted on geographies consisting of 78,142,569 people shows a mild positive correlation between the proportion of Senegalese and percentage of population with at least college, under 1 year education in the United States with a correlation coefficient (R) of 0.332 and weighted average of 63.6%. Similarly, the statistical analysis conducted on geographies consisting of 132,646,607 people shows no correlation between the proportion of Macedonians and percentage of population with at least college, under 1 year education in the United States with a correlation coefficient (R) of 0.046 and weighted average of 67.6%, a difference of 6.3%.
College, Under 1 year Correlation Summary
| Measurement | Senegalese | Macedonian |
| Minimum | 39.1% | 45.2% |
| Maximum | 100.0% | 91.1% |
| Range | 60.9% | 45.9% |
| Mean | 65.6% | 67.7% |
| Median | 64.7% | 68.1% |
| Interquartile 25% (IQ1) | 60.2% | 65.6% |
| Interquartile 75% (IQ3) | 70.5% | 71.8% |
| Interquartile Range (IQR) | 10.4% | 6.2% |
| Standard Deviation (Sample) | 11.1% | 8.9% |
| Standard Deviation (Population) | 11.0% | 8.8% |
Similar Demographics by College, Under 1 year
Demographics Similar to Senegalese by College, Under 1 year
In terms of college, under 1 year, the demographic groups most similar to Senegalese are Hmong (63.5%, a difference of 0.15%), Immigrants from Nigeria (63.7%, a difference of 0.17%), Immigrants from South America (63.8%, a difference of 0.21%), Immigrants from Uruguay (63.4%, a difference of 0.34%), and Immigrants from Panama (63.4%, a difference of 0.36%).
| Demographics | Rating | Rank | College, Under 1 year |
| Immigrants | Vietnam | 12.1 /100 | #208 | Poor 64.0% |
| Puget Sound Salish | 11.3 /100 | #209 | Poor 63.9% |
| Ghanaians | 11.2 /100 | #210 | Poor 63.9% |
| Native Hawaiians | 10.6 /100 | #211 | Poor 63.9% |
| Immigrants | Middle Africa | 10.5 /100 | #212 | Poor 63.9% |
| Immigrants | South America | 9.1 /100 | #213 | Tragic 63.8% |
| Immigrants | Nigeria | 8.8 /100 | #214 | Tragic 63.7% |
| Senegalese | 7.7 /100 | #215 | Tragic 63.6% |
| Hmong | 6.8 /100 | #216 | Tragic 63.5% |
| Immigrants | Uruguay | 5.8 /100 | #217 | Tragic 63.4% |
| Immigrants | Panama | 5.7 /100 | #218 | Tragic 63.4% |
| Immigrants | Fiji | 5.7 /100 | #219 | Tragic 63.4% |
| Portuguese | 5.6 /100 | #220 | Tragic 63.4% |
| Cree | 5.2 /100 | #221 | Tragic 63.3% |
| Immigrants | Senegal | 5.0 /100 | #222 | Tragic 63.3% |
Demographics Similar to Macedonians by College, Under 1 year
In terms of college, under 1 year, the demographic groups most similar to Macedonians are Scandinavian (67.7%, a difference of 0.020%), Assyrian/Chaldean/Syriac (67.7%, a difference of 0.020%), Ukrainian (67.7%, a difference of 0.020%), Syrian (67.6%, a difference of 0.030%), and Immigrants from Egypt (67.7%, a difference of 0.080%).
| Demographics | Rating | Rank | College, Under 1 year |
| Afghans | 96.6 /100 | #105 | Exceptional 67.8% |
| Immigrants | Croatia | 96.6 /100 | #106 | Exceptional 67.8% |
| Austrians | 96.4 /100 | #107 | Exceptional 67.8% |
| Immigrants | Egypt | 96.0 /100 | #108 | Exceptional 67.7% |
| Scandinavians | 95.8 /100 | #109 | Exceptional 67.7% |
| Assyrians/Chaldeans/Syriacs | 95.8 /100 | #110 | Exceptional 67.7% |
| Ukrainians | 95.8 /100 | #111 | Exceptional 67.7% |
| Macedonians | 95.7 /100 | #112 | Exceptional 67.6% |
| Syrians | 95.6 /100 | #113 | Exceptional 67.6% |
| Chileans | 95.3 /100 | #114 | Exceptional 67.6% |
| Basques | 95.2 /100 | #115 | Exceptional 67.6% |
| Immigrants | Nepal | 94.9 /100 | #116 | Exceptional 67.5% |
| Pakistanis | 94.8 /100 | #117 | Exceptional 67.5% |
| Immigrants | Ukraine | 94.7 /100 | #118 | Exceptional 67.5% |
| Lebanese | 94.6 /100 | #119 | Exceptional 67.5% |