Yugoslavian vs Immigrants from Morocco Bachelor's Degree
COMPARE
Yugoslavian
Immigrants from Morocco
Bachelor's Degree
Bachelor's Degree Comparison
Yugoslavians
Immigrants from Morocco
37.1%
BACHELOR'S DEGREE
31.5/ 100
METRIC RATING
193rd/ 347
METRIC RANK
41.4%
BACHELOR'S DEGREE
98.0/ 100
METRIC RATING
101st/ 347
METRIC RANK
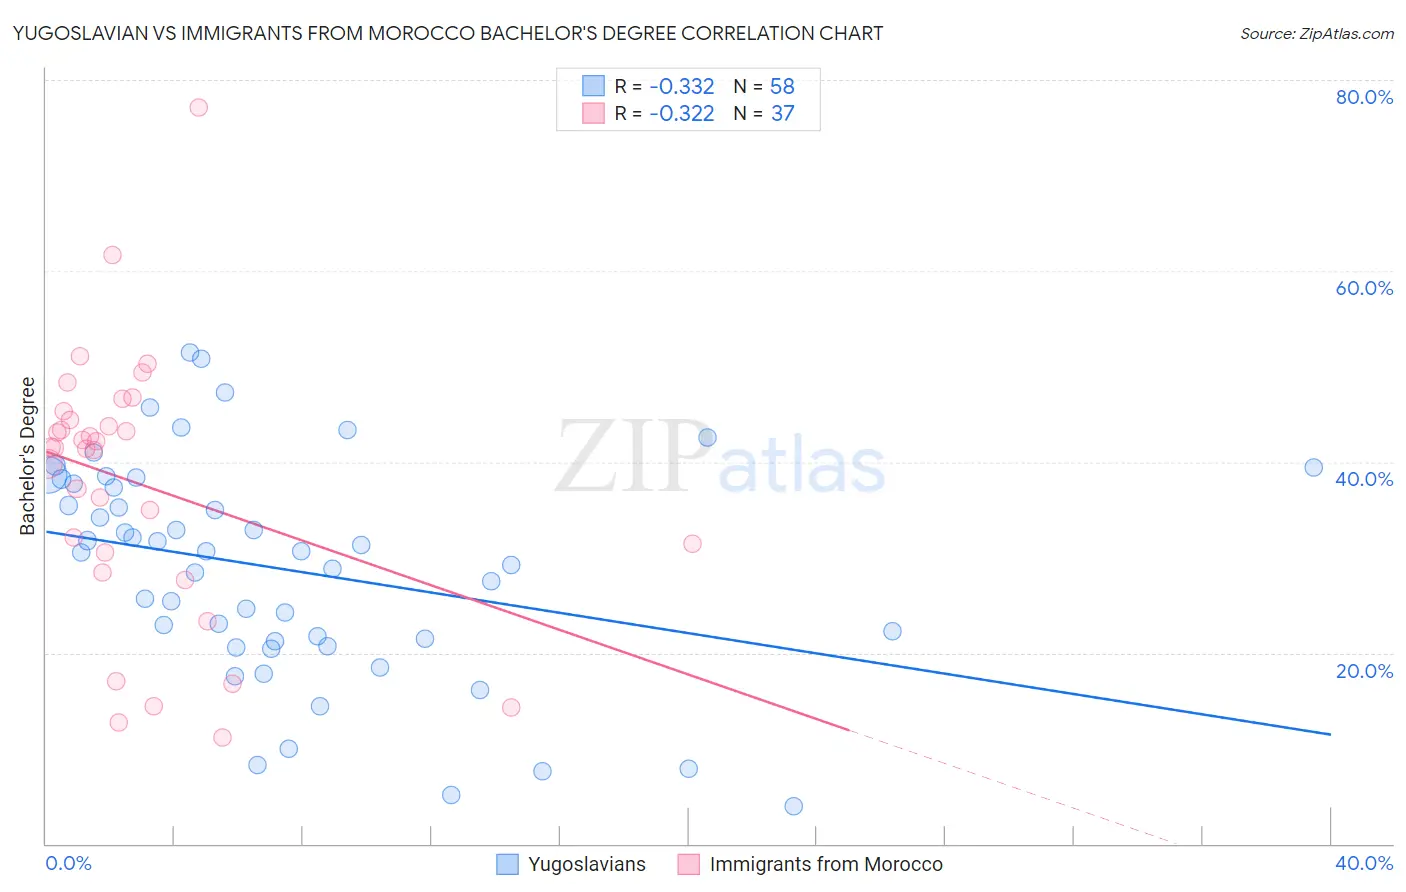
Yugoslavian vs Immigrants from Morocco Bachelor's Degree Correlation Chart
The statistical analysis conducted on geographies consisting of 285,712,263 people shows a mild negative correlation between the proportion of Yugoslavians and percentage of population with at least bachelor's degree education in the United States with a correlation coefficient (R) of -0.332 and weighted average of 37.1%. Similarly, the statistical analysis conducted on geographies consisting of 178,912,438 people shows a mild negative correlation between the proportion of Immigrants from Morocco and percentage of population with at least bachelor's degree education in the United States with a correlation coefficient (R) of -0.322 and weighted average of 41.4%, a difference of 11.6%.
Bachelor's Degree Correlation Summary
| Measurement | Yugoslavian | Immigrants from Morocco |
| Minimum | 3.9% | 11.1% |
| Maximum | 51.4% | 77.2% |
| Range | 47.5% | 66.0% |
| Mean | 28.7% | 37.7% |
| Median | 30.6% | 41.4% |
| Interquartile 25% (IQ1) | 21.2% | 29.5% |
| Interquartile 75% (IQ3) | 37.7% | 44.9% |
| Interquartile Range (IQR) | 16.5% | 15.4% |
| Standard Deviation (Sample) | 11.5% | 14.0% |
| Standard Deviation (Population) | 11.4% | 13.8% |
Similar Demographics by Bachelor's Degree
Demographics Similar to Yugoslavians by Bachelor's Degree
In terms of bachelor's degree, the demographic groups most similar to Yugoslavians are Immigrants from Vietnam (37.1%, a difference of 0.060%), Belgian (37.0%, a difference of 0.19%), Korean (37.0%, a difference of 0.20%), Celtic (37.0%, a difference of 0.23%), and Nigerian (37.2%, a difference of 0.27%).
| Demographics | Rating | Rank | Bachelor's Degree |
| Norwegians | 40.4 /100 | #186 | Average 37.5% |
| English | 39.7 /100 | #187 | Fair 37.4% |
| Immigrants | Oceania | 37.3 /100 | #188 | Fair 37.3% |
| Slovaks | 36.9 /100 | #189 | Fair 37.3% |
| Swiss | 34.1 /100 | #190 | Fair 37.2% |
| Nigerians | 33.9 /100 | #191 | Fair 37.2% |
| Immigrants | Vietnam | 32.1 /100 | #192 | Fair 37.1% |
| Yugoslavians | 31.5 /100 | #193 | Fair 37.1% |
| Belgians | 29.9 /100 | #194 | Fair 37.0% |
| Koreans | 29.8 /100 | #195 | Fair 37.0% |
| Celtics | 29.5 /100 | #196 | Fair 37.0% |
| Czechoslovakians | 29.2 /100 | #197 | Fair 37.0% |
| Welsh | 29.1 /100 | #198 | Fair 37.0% |
| Immigrants | Costa Rica | 27.4 /100 | #199 | Fair 36.9% |
| Immigrants | Ghana | 27.4 /100 | #200 | Fair 36.9% |
Demographics Similar to Immigrants from Morocco by Bachelor's Degree
In terms of bachelor's degree, the demographic groups most similar to Immigrants from Morocco are Macedonian (41.4%, a difference of 0.030%), Immigrants from England (41.4%, a difference of 0.060%), Immigrants from Italy (41.3%, a difference of 0.26%), Immigrants from Ukraine (41.5%, a difference of 0.29%), and Romanian (41.6%, a difference of 0.40%).
| Demographics | Rating | Rank | Bachelor's Degree |
| Immigrants | Nepal | 98.6 /100 | #94 | Exceptional 41.7% |
| Immigrants | North America | 98.5 /100 | #95 | Exceptional 41.7% |
| Immigrants | Moldova | 98.4 /100 | #96 | Exceptional 41.6% |
| Romanians | 98.4 /100 | #97 | Exceptional 41.6% |
| Immigrants | Ukraine | 98.3 /100 | #98 | Exceptional 41.5% |
| Immigrants | England | 98.1 /100 | #99 | Exceptional 41.4% |
| Macedonians | 98.1 /100 | #100 | Exceptional 41.4% |
| Immigrants | Morocco | 98.0 /100 | #101 | Exceptional 41.4% |
| Immigrants | Italy | 97.8 /100 | #102 | Exceptional 41.3% |
| Chileans | 97.5 /100 | #103 | Exceptional 41.2% |
| Jordanians | 97.4 /100 | #104 | Exceptional 41.2% |
| Syrians | 97.4 /100 | #105 | Exceptional 41.1% |
| Alsatians | 97.0 /100 | #106 | Exceptional 41.0% |
| Northern Europeans | 96.8 /100 | #107 | Exceptional 41.0% |
| Ukrainians | 96.6 /100 | #108 | Exceptional 40.9% |