Immigrants from North Macedonia vs Immigrants from Morocco Bachelor's Degree
COMPARE
Immigrants from North Macedonia
Immigrants from Morocco
Bachelor's Degree
Bachelor's Degree Comparison
Immigrants from North Macedonia
Immigrants from Morocco
39.2%
BACHELOR'S DEGREE
81.6/ 100
METRIC RATING
142nd/ 347
METRIC RANK
41.4%
BACHELOR'S DEGREE
98.0/ 100
METRIC RATING
101st/ 347
METRIC RANK
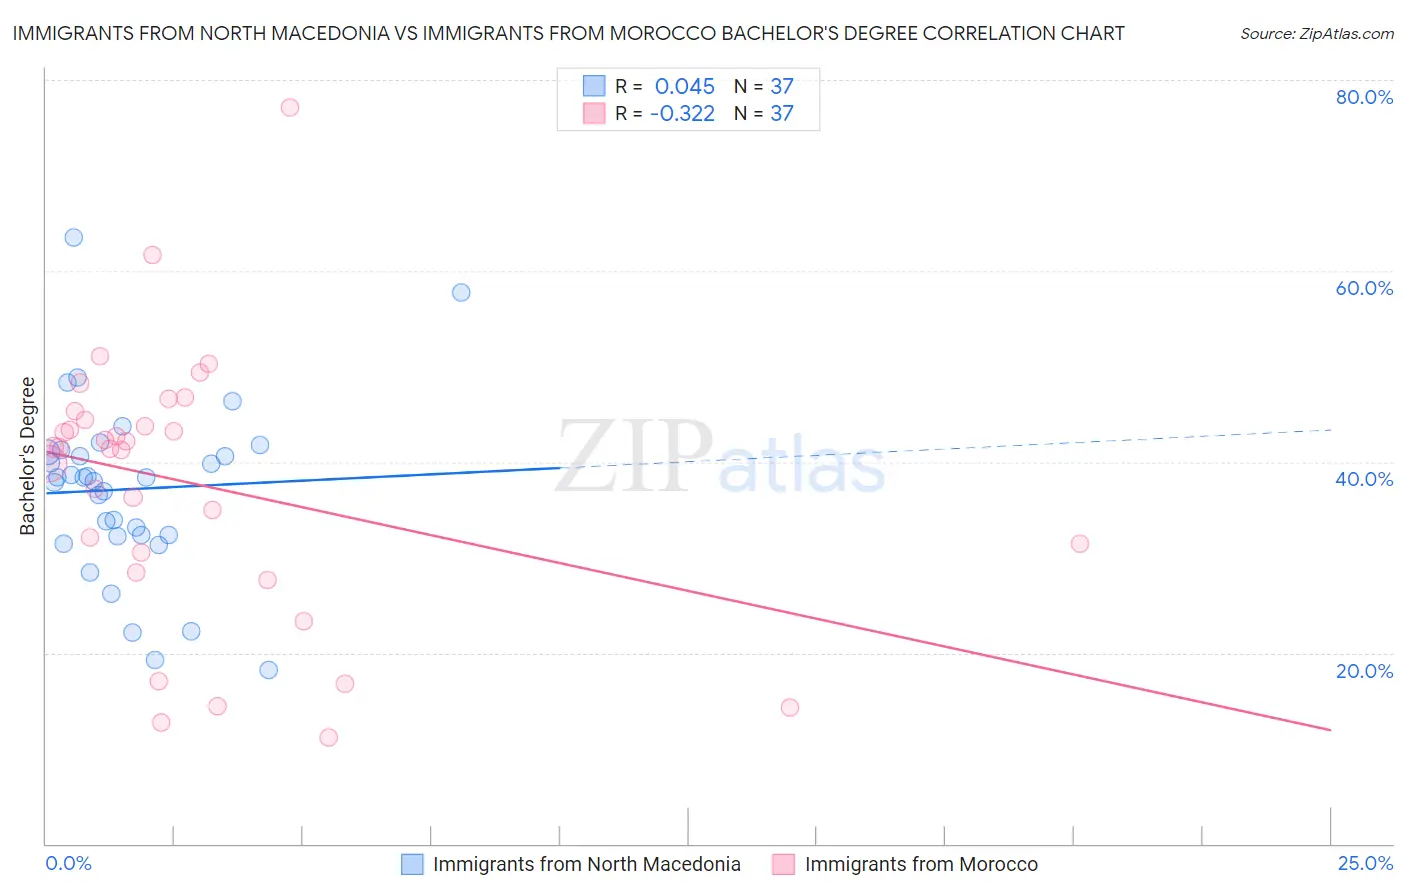
Immigrants from North Macedonia vs Immigrants from Morocco Bachelor's Degree Correlation Chart
The statistical analysis conducted on geographies consisting of 74,314,153 people shows no correlation between the proportion of Immigrants from North Macedonia and percentage of population with at least bachelor's degree education in the United States with a correlation coefficient (R) of 0.045 and weighted average of 39.2%. Similarly, the statistical analysis conducted on geographies consisting of 178,912,438 people shows a mild negative correlation between the proportion of Immigrants from Morocco and percentage of population with at least bachelor's degree education in the United States with a correlation coefficient (R) of -0.322 and weighted average of 41.4%, a difference of 5.7%.
Bachelor's Degree Correlation Summary
| Measurement | Immigrants from North Macedonia | Immigrants from Morocco |
| Minimum | 18.2% | 11.1% |
| Maximum | 63.5% | 77.2% |
| Range | 45.3% | 66.0% |
| Mean | 37.1% | 37.7% |
| Median | 38.3% | 41.4% |
| Interquartile 25% (IQ1) | 32.3% | 29.5% |
| Interquartile 75% (IQ3) | 41.1% | 44.9% |
| Interquartile Range (IQR) | 8.9% | 15.4% |
| Standard Deviation (Sample) | 9.3% | 14.0% |
| Standard Deviation (Population) | 9.2% | 13.8% |
Similar Demographics by Bachelor's Degree
Demographics Similar to Immigrants from North Macedonia by Bachelor's Degree
In terms of bachelor's degree, the demographic groups most similar to Immigrants from North Macedonia are Polish (39.1%, a difference of 0.27%), Immigrants from Afghanistan (39.1%, a difference of 0.29%), South American Indian (39.3%, a difference of 0.32%), Slovene (39.1%, a difference of 0.32%), and Swedish (39.1%, a difference of 0.36%).
| Demographics | Rating | Rank | Bachelor's Degree |
| Luxembourgers | 89.1 /100 | #135 | Excellent 39.8% |
| Pakistanis | 88.2 /100 | #136 | Excellent 39.7% |
| Icelanders | 86.5 /100 | #137 | Excellent 39.5% |
| Europeans | 85.6 /100 | #138 | Excellent 39.5% |
| Immigrants | Sudan | 84.5 /100 | #139 | Excellent 39.4% |
| Immigrants | Armenia | 84.1 /100 | #140 | Excellent 39.4% |
| South American Indians | 83.6 /100 | #141 | Excellent 39.3% |
| Immigrants | North Macedonia | 81.6 /100 | #142 | Excellent 39.2% |
| Poles | 79.8 /100 | #143 | Good 39.1% |
| Immigrants | Afghanistan | 79.7 /100 | #144 | Good 39.1% |
| Slovenes | 79.5 /100 | #145 | Good 39.1% |
| Swedes | 79.2 /100 | #146 | Good 39.1% |
| Immigrants | Sierra Leone | 79.0 /100 | #147 | Good 39.0% |
| Iraqis | 78.1 /100 | #148 | Good 39.0% |
| Immigrants | Poland | 77.5 /100 | #149 | Good 39.0% |
Demographics Similar to Immigrants from Morocco by Bachelor's Degree
In terms of bachelor's degree, the demographic groups most similar to Immigrants from Morocco are Macedonian (41.4%, a difference of 0.030%), Immigrants from England (41.4%, a difference of 0.060%), Immigrants from Italy (41.3%, a difference of 0.26%), Immigrants from Ukraine (41.5%, a difference of 0.29%), and Romanian (41.6%, a difference of 0.40%).
| Demographics | Rating | Rank | Bachelor's Degree |
| Immigrants | Nepal | 98.6 /100 | #94 | Exceptional 41.7% |
| Immigrants | North America | 98.5 /100 | #95 | Exceptional 41.7% |
| Immigrants | Moldova | 98.4 /100 | #96 | Exceptional 41.6% |
| Romanians | 98.4 /100 | #97 | Exceptional 41.6% |
| Immigrants | Ukraine | 98.3 /100 | #98 | Exceptional 41.5% |
| Immigrants | England | 98.1 /100 | #99 | Exceptional 41.4% |
| Macedonians | 98.1 /100 | #100 | Exceptional 41.4% |
| Immigrants | Morocco | 98.0 /100 | #101 | Exceptional 41.4% |
| Immigrants | Italy | 97.8 /100 | #102 | Exceptional 41.3% |
| Chileans | 97.5 /100 | #103 | Exceptional 41.2% |
| Jordanians | 97.4 /100 | #104 | Exceptional 41.2% |
| Syrians | 97.4 /100 | #105 | Exceptional 41.1% |
| Alsatians | 97.0 /100 | #106 | Exceptional 41.0% |
| Northern Europeans | 96.8 /100 | #107 | Exceptional 41.0% |
| Ukrainians | 96.6 /100 | #108 | Exceptional 40.9% |